
A watchlist should do more than flash green and red price changes. For an income investor, its job is to highlight when the original investment case needs another look. That can happen after an earnings release, a dividend declaration, a credit downgrade or a sharp price move. A lower price is a reason to investigate; it is not, by itself, a reason to buy.
Here is a practical structure for a dividend watchlist that works whether you track five companies or fifty.
Keep the thesis to one sentence
For each company, write one plain-English reason it belongs on the list: “Recurring customer revenue may support a steadily growing payout if debt stays manageable.” Then add the condition that would challenge the thesis: “Revisit if cash flow no longer covers capital spending and dividends.”
This gives future you a testable question rather than an emotional attachment to a ticker. Avoid inserting an exact buy price unless you can explain the assumptions behind it.
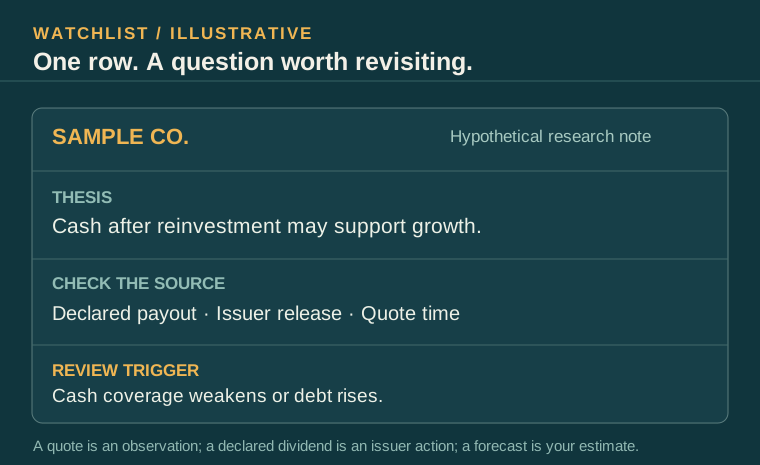
Add a date beside the thesis. A note written before a major acquisition or a new debt issue may no longer describe the same business. Keep the earlier version so you can see whether the company changed or your original assumption was wrong. A watchlist becomes valuable when it records decisions and revisions, not merely prices.
Record the fields that change the decision
A useful row contains:
- Company, ticker and business type.
- Current price and the timestamp and source of that quote.
- Declared dividend per share and payment frequency. Mark future undeclared amounts as estimates.
- Indicated yield, computed from the current quote and declared or clearly labeled annualized payout.
- Recent earnings and cash-flow trend, plus the period covered.
- Cash dividends paid, capital spending and a relevant coverage measure.
- Debt maturities, liquidity or regulatory capital where applicable.
- The next earnings date and any announced dividend dates.
- A short note explaining what would change your mind.
These fields should not all be collapsed into one score. A bank, a manufacturer and a REIT require different coverage measures. For example, Nareit uses FFO as a supplemental REIT performance measure, while a manufacturer's cash-flow statement may be a more natural starting point.
Separate the three layers of a number
A price is a market observation, a declared dividend is an issuer action, and a projected payment is your estimate. Show these as different data types. A timestamped quote can still be delayed; a declaration can be revised; an estimate should never inherit the visual authority of a confirmed payment. This matters especially when a watchlist feeds an income calendar or a portfolio total.
For each calculated field, store enough information to reproduce it: source, source date, reporting period, units and formula. If an annualized dividend is based on the latest quarterly declaration multiplied by four, say so. If a company pays irregularly, a simple multiplication can be misleading. Do not let a polished interface conceal an assumption.
Add three kinds of alerts
Event alerts tell you that a company has declared a dividend, reported results or updated guidance. They should link to the original issuer release or filing and show the event time.
Change alerts compare the new information with the previous period: an increase or cut in the payout, weaker cash conversion, a rising debt load or a material change in outlook. The alert should state the actual change, not guess whether the stock is a bargain.
Staleness alerts warn when a quote or dividend amount has not been refreshed. A portfolio number with no timestamp can look precise while being wrong. Estimates and confirmed figures should remain visibly separate.
The SEC's financial statement guide is a good reminder that earnings, balance sheet and cash flow each describe a different part of a company. A watchlist should make it easy to move from a headline to those original documents.
| Alert | Good trigger | Action for the reader |
|---|---|---|
| Dividend declared | New issuer announcement | Compare amount and dates with the prior declaration |
| Results filed | New 10-Q or 10-K | Recalculate the relevant coverage measure |
| Price moved sharply | Quote crossed a threshold you chose | Look for the news and recheck the thesis |
| Data became stale | Quote or payout has no recent verification | Refresh the source before trusting the dashboard |
The alert is a prompt to read, not a trade signal. In particular, a share-price decline can lift the displayed yield automatically. Investigate whether earnings, cash flow, debt or valuation changed before calling the lower price a bargain.
Watch concentration, too
Income can look diversified when payments arrive from many tickers, yet still depend heavily on one sector, one interest-rate environment or one underlying company. Investor.gov explains that diversification means spreading risk across and within asset classes, and that narrowly focused funds may not provide as much variety as their number of holdings suggests.
Track portfolio weights by sector and by source of income. If several holdings would struggle under the same economic shock, count that as a common risk even if their logos differ. A monthly income chart is helpful for planning; it is not proof that the underlying cash flows are independent.
Try viewing concentration two ways. Suppose a hypothetical portfolio has five equal-sized positions, but one produces 40% of all expected dividends. Equal market value does not mean equal income dependence. Conversely, the position with the highest indicated yield can lose both value and future income if its payout is reduced. Mark “expected income” as an estimate until each payment is declared, and recompute concentration after a cut or a large price move.
A ten-minute monthly review
- Open the watchlist and check whether any issuer has declared, changed or suspended a dividend.
- Read new 10-Q or 10-K filings for the names whose earnings or cash coverage changed materially.
- Update debt maturities, a relevant operating metric and the reason each company remains on the list.
- Reconcile announced payments with your income calendar and actual broker cash activity.
- Look at sector and income concentration, then write one question for the next issuer release.
The point is not to research every company every day. It is to make a change in the business visible early enough to ask the right question. A shortlist of three companies with dated notes can be more useful than fifty tickers with no thesis.
Review on a schedule, investigate on an event
A short monthly review can check whether your thesis, expected payments and concentration have changed. Between reviews, respond to meaningful company events rather than every price tick. This reduces noise while keeping the watchlist useful.
The goal is not to predict the next day's share price. It is to know why a company is on your list and what evidence would make you revisit that decision.
This is an educational workflow, not a recommendation or personalized portfolio plan.