A bank dividend is paid from profits only after the bank has absorbed losses and met capital rules. That sounds obvious until a simple dividend screen treats JPMorgan Chase (JPM) and Bank of America (BAC) like two industrial companies with comparable free cash flow. Their cash-flow statements contain enormous movements in deposits, loans and securities. A manufacturing-style “operating cash flow minus capex” payout ratio is a poor shortcut for either bank.

The more useful question is how the dividend fits beside earnings quality, credit costs, common equity capital and repurchases. Both firms had reported third-quarter 2026 results by the October 24 research cutoff. This comparison uses that same quarter for current facts and keeps one-time items visible. It does not use a live stock price, because the price and dividend yield can change before a reader sees the article. JPMorgan Chase Q3 2026 release · Bank of America Q3 2026 release
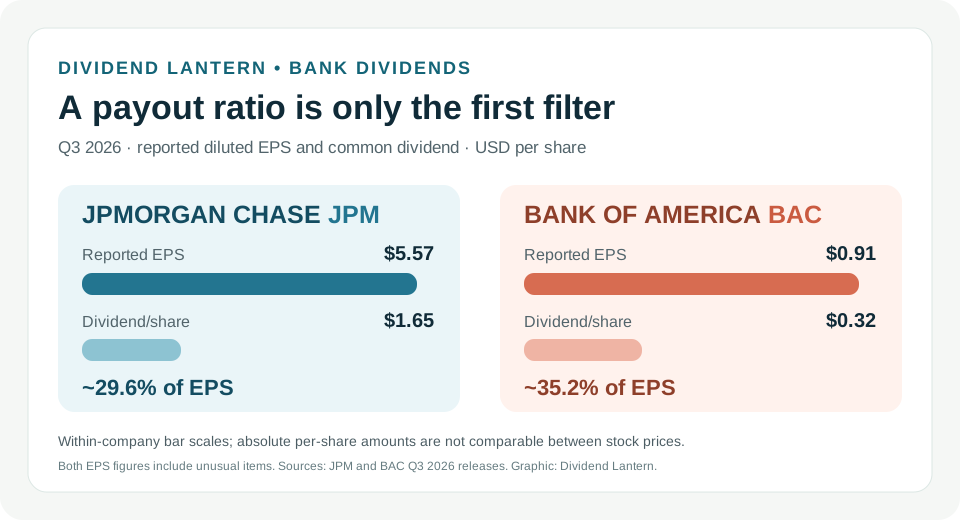
Chart: Q3 2026, USD per common share; simple dividend divided by reported diluted EPS, approximately 30% for JPMorgan and 35% for Bank of America. Each quarter included an unusual item, so these are quarterly arithmetic checks, not durable payout promises. [JPM release](https://www.jpmorganchase.com/content/dam/jpmc/jpmorgan-chase-and-co/investor-relations/documents/quarterly-earnings/2026/3rd-quarter/6c1f8114-1be4-4174-8292-f75bbb59bc21.pdf) · [BAC release](https://investor.bankofamerica.com/regulatory-and-other-filings/select-sec-filings/content/0000070858-26-000481/bac09302026ex991.htm).
The ratio works—until the quarter changes
JPMorgan reported $5.57 in diluted earnings per share and a $1.65 common dividend for Q3 2026. Bank of America reported $0.91 in diluted EPS; its quarterly common dividend had been increased to $0.32 per share. Simple division gives roughly 29.6% and 35.2%, respectively. Both figures leave apparent room below 100%. Yet it would be wrong to conclude that JPMorgan is “safe” by exactly six percentage points. A single quarter is a thin sample for a lender, and earnings can shift abruptly when credit costs or market marks change. JPMorgan Q3 release · Bank of America Q3 release · Bank of America dividend declaration
The reported quarter itself shows why normalization requires care. JPMorgan's results included $658 million of net investment-securities losses, which the company said reduced EPS by $0.18. Bank of America's results included a $1.2 billion regulatory settlement charge; it reported adjusted EPS of $1.08 excluding that item, a non-GAAP measure. Both charges affected the reported figures, and neither can simply be wished away when judging shareholder cash available over time. They also are not the same type of event. Using only the adjusted number for one bank and only reported earnings for the other would bias the comparison. JPMorgan Q3 release · Bank of America Q3 release
Nor do the absolute dividend-per-share amounts tell us which shareholder receives a better income return. One share of JPMorgan and one share of Bank of America have different prices and represent different fractions of each firm. Calculate dividend yield using a current market price, then ask whether the extra yield—if there is one—compensates for the bank's risks and growth outlook. A lower share price can make the yield rise even while the bank's economics deteriorate.
Why bank cash flow is different
For a bank, deposits are liabilities and loans are assets; a change in either can create giant cash-flow movements unrelated to the “free cash flow” concept used for a consumer-products business. The dividend instead competes with retaining capital against losses, growing risk-weighted assets and buying back stock. That is why CET1, the common-equity Tier 1 capital ratio, belongs beside earnings when assessing distributions.
At September 30, 2026, JPMorgan reported a 13.9% standardized CET1 ratio and approximately $304 billion of CET1 capital. Bank of America reported 10.9% and approximately $198 billion, respectively. These are reported ratios, not a simple ranking of dividend safety. The banks have different portfolios, risk-weighted assets, buffers and binding capital requirements; Bank of America's release says its binding ratio that quarter was the total capital ratio under the standardized approach. The key follow-up is each firm's headroom over its own requirements after stress, not the 3.0-point gap between two headline ratios. JPMorgan Q3 release · Bank of America Q3 presentation
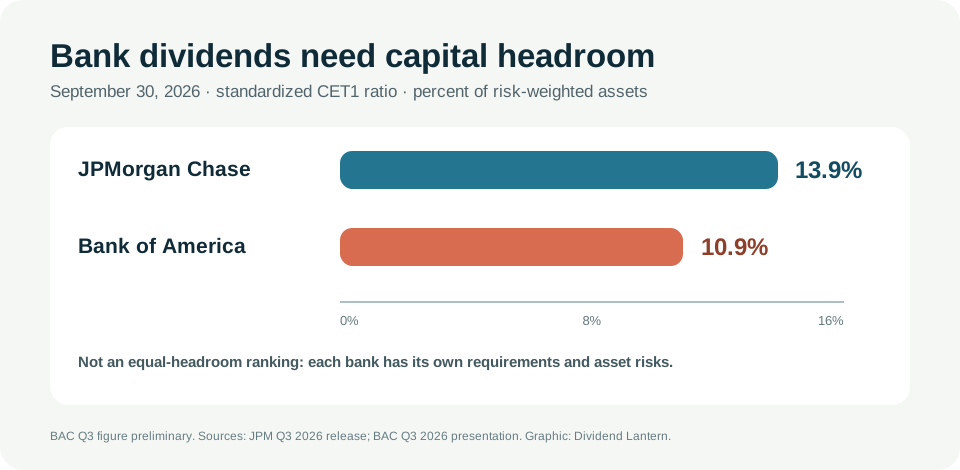
Chart: quarter-end Q3 2026 standardized CET1. Bank of America's metric was marked preliminary in its release. A higher absolute ratio does not alone prove a larger regulatory buffer. [JPM release](https://www.jpmorganchase.com/content/dam/jpmc/jpmorgan-chase-and-co/investor-relations/documents/quarterly-earnings/2026/3rd-quarter/6c1f8114-1be4-4174-8292-f75bbb59bc21.pdf) · [BAC presentation](https://investor.bankofamerica.com/regulatory-and-other-filings/select-sec-filings/content/0000070858-26-000481/bac09302026ex992.htm).
The business mix matters too. JPMorgan reports Consumer & Community Banking, Commercial & Investment Bank and Asset & Wealth Management, plus Corporate. Bank of America reports Consumer Banking, Global Wealth & Investment Management, Global Banking and Global Markets, plus All Other. Both can make money from lending, deposits, payments, advice and markets, but their exact exposures and earnings sensitivities differ. A change in rates can help net interest income in one period and pressure deposit costs or credit quality in another. Compare the segment disclosures, not merely the familiar logos. JPMorgan 2025 Form 10-K · Bank of America 2025 Form 10-K
The flexible distribution is usually the buyback
The capital-return mix differed strikingly this quarter. JPMorgan listed $4.4 billion of common dividends and $664 million of net common-stock repurchases. Bank of America reported $2.2 billion of common dividends and $6.0 billion of common-stock repurchases. The repurchase definitions are not perfectly matched, so the numbers are not a clean efficiency contest. They do show that looking at the dividend alone hides a large discretionary capital-allocation choice. A board can often cut buybacks before touching a regular dividend, although no particular response is guaranteed in a stress. JPMorgan Q3 release · Bank of America Q3 release
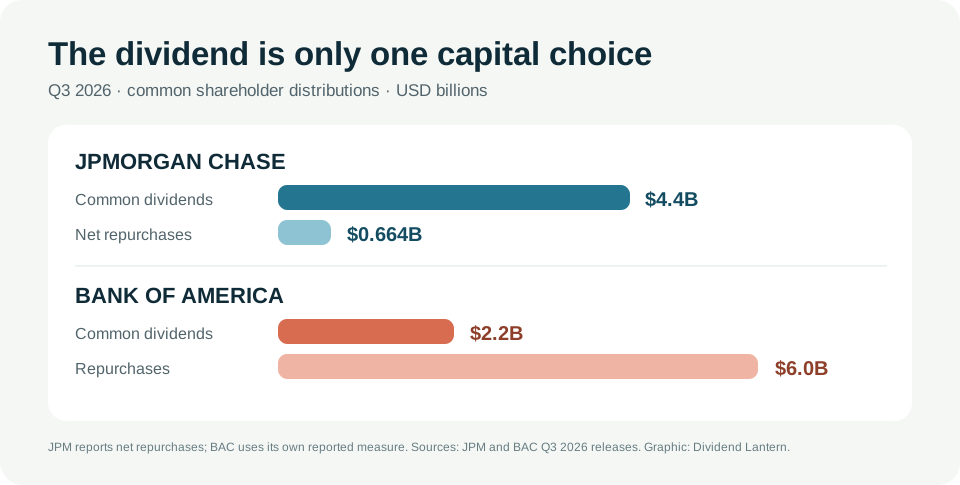
Chart: Q3 2026, USD billions, as described by each bank. JPMorgan labels repurchases net; Bank of America's reported repurchases use its own presentation. The bars should not be treated as identical definitions. [JPM release](https://www.jpmorganchase.com/content/dam/jpmc/jpmorgan-chase-and-co/investor-relations/documents/quarterly-earnings/2026/3rd-quarter/6c1f8114-1be4-4174-8292-f75bbb59bc21.pdf) · [BAC release](https://investor.bankofamerica.com/regulatory-and-other-filings/select-sec-filings/content/0000070858-26-000481/bac09302026ex991.htm).
To judge whether that flexibility is real, track share count as well as announced repurchases. Buying stock can offset employee compensation, shrink the count, or do a mixture of both. The capital used in a buyback is no longer available for loan losses or the dividend. An announced authorization is permission, not a commitment to spend it.
Credit costs are the test a quiet quarter may hide
JPMorgan reported $2.7 billion of credit costs in Q3 2026, including $2.2 billion of net charge-offs and a $539 million net reserve build. Bank of America reported a $1.3 billion provision for credit losses and approximately $1.3 billion of net charge-offs. Dollar totals are not directly comparable across banks of different size and portfolios. The direction of loss rates, delinquencies and provisions over several quarters is more informative than one quarter's payout percentage. JPMorgan Q3 release · Bank of America Q3 release
There is also interest-rate risk beyond loan defaults. The value of securities and the cost of deposits can move against a bank; a strong net-interest-income quarter does not assure the next one. Investors should review the banks' securities portfolios, deposit trends and capital sensitivity disclosures when rates shift. If a bank's capital ratio falls as it distributes cash and grows its balance sheet, a seemingly modest dividend can become less flexible.
Four questions for the next release
- Earnings: Is the common dividend still a sensible share of through-cycle earnings after credit costs, rather than just this quarter's adjusted EPS?
- Capital: How much CET1 capital and regulatory headroom remain after risk-weighted-asset growth, marks and shareholder distributions?
- Credit: Are charge-offs and delinquency trends worsening in specific loan categories, especially where exposure is concentrated?
- Price: At the current stock price, what yield and valuation are you receiving for these risks? A cheap-looking yield does not compensate for every possible capital drawdown.
Our reading: Both banks' reported Q3 2026 earnings covered their common dividends by a wide margin on a simple per-share check. That is reassuring evidence for the quarter, not a forward guarantee. JPMorgan's reported capital ratio was higher; Bank of America's capital-return mix included much larger repurchases. The most durable dividend case is the one that survives weaker credit, a less favorable rate environment and a tighter capital buffer—at a reasonable price.
Educational analysis of public filings available October 24, 2026; not personalized investment advice. One-time charges and non-GAAP adjustments are identified, not assumed to disappear. Dividend declarations and buybacks remain subject to board decisions and regulatory constraints.