
Which would you rather own: an investment yielding 5% today, or one yielding 2.5% whose dividend grows 10% a year? The answer depends on more than the first payment. It also depends on whether the projected growth is realistic, how long you expect to hold the investment, and what happens to the share price.
Let's isolate the income math first. This is a hypothetical exercise, not a forecast for any stock.
Two investments, the same $100 starting amount
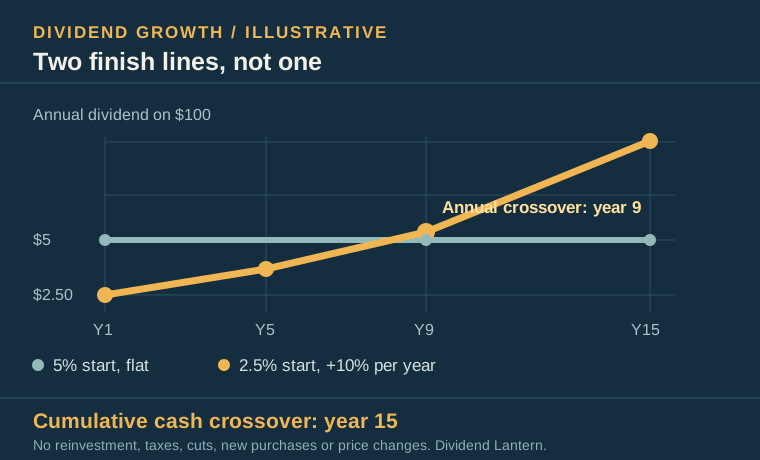
Assume Investment A pays $5 in dividends in year one and never raises the payout. Investment B pays $2.50 in year one and increases the dividend by 10% each year. Assume no reinvestment, taxes, dividend cuts or additional purchases.
| Year | A: 5% starting yield, no growth | B: 2.5% starting yield, 10% growth |
|---|---|---|
| 1 | $5.00 | $2.50 |
| 5 | $5.00 | $3.66 |
| 8 | $5.00 | $4.87 |
| 9 | $5.00 | $5.36 |
| 10 | $5.00 | $5.89 |
Investment B's annual cash payment first exceeds A's in year nine. But that does not mean B has already paid more money in total. Over the first ten years, A would have distributed $50; B would have distributed about $39.84. Under these exact assumptions, B's cumulative dividends do not pass A's until year fifteen.
The distinction matters. A chart showing only the year in which the two annual dividend lines cross can make the slower-starting investment look as though it has already recovered years of smaller checks.
The equation worth keeping
If the initial annual dividend is D and the growth rate is g, the assumed payment in year n is:
Year-n dividend = D × (1 + g)^(n − 1)
This makes a useful calculator input, but it is not a promise. A constant 10% increase for fifteen years is a demanding assumption. The company needs a durable way to grow the cash supporting that dividend, and its board must choose to keep sharing the growth.
For cumulative cash without reinvestment, add each year's payment. With a constant assumed growth rate above zero, the total through year n is D × ((1 + g)^n − 1) ÷ g. The formula is useful for checking the table, not for turning a growth assumption into a forecast. At zero growth, the cumulative amount is simply D × n.
Change one assumption at a time
Keep A fixed at $5 annually and B starting at $2.50. The results are highly sensitive to the growth assumption:
| B's assumed annual dividend growth | First year B's annual payment exceeds A | First year B's cumulative cash exceeds A |
|---|---|---|
| 6% | 13 | 23 |
| 8% | 11 | 18 |
| 10% | 9 | 15 |
| 12% | 8 | 12 |
These crossover years are calculated from the hypothetical formula, with no reinvestment or cuts. Even the 6% case needs more than two decades to overtake A in cash received. If B grows faster for five years and then slows, the crossover moves again. That is why a single assumed CAGR should be shown as a scenario, not the expected outcome.
A dividend can grow while your income does not
If you sell part of a holding, the company's per-share dividend can rise while your total cash receipts fall. If a company issues new shares and spreads its cash generation over more shares, dividend growth per share may be harder to sustain than growth in total dividends paid. Check per-share figures and share count, not only a headline about a larger cash distribution.
What the tidy example leaves out
Real investing adds at least four complications.
First, total return includes price changes as well as dividends. A company can increase its dividend while its share price falls, or pay a modest dividend while its stock appreciates substantially. The SEC cautions that distributions alone are not a reliable measure of fund performance; the same principle of looking at the whole return applies when comparing income investments.
Second, dividend growth can slow or stop. A company growing its payment by 10% for five years may face weaker demand, higher capital spending or more expensive debt. Recalculate with conservative growth rates and with a flat-dividend case.
Third, reinvestment changes the number of shares owned. Reinvesting dividends can compound future income, but its result depends on future prices and whether the payout continues.
Fourth, taxes and the account in which you hold the investment can change the amount of cash you keep. Personal tax treatment varies, so a pretax income chart should not be mistaken for spendable income.
Inflation is a fifth complication. A flat $5 payment buys less after years of rising prices. But a company cannot raise its dividend sustainably just because investors need more purchasing power. Its business must earn and convert enough cash to support the increase. A lower-yielding company with strong pricing power may be attractive, but price increases can also bring volume pressure or higher costs.
Finally, do not compare the $5 and $2.50 payments while silently assuming equal risk. Starting yield is one outcome of price and dividend policy; it is not a measure of business quality. A high yield could reflect lower growth, a temporary bargain or genuine distress. A low yield could reflect strength—or an expensive stock.
A better way to compare candidates
Write down the starting yield, the growth rate you believe the business can fund, and the years until annual and cumulative dividends catch up. Then compare cash-flow coverage, debt, valuation and total-return risk. The best choice may still be the higher current yield if income is needed soon. It may be the lower starting yield if durable growth and a long horizon justify the wait. It may also be neither.
The lesson is simple: a high yield wins the first year; sustained dividend growth can win later. The word sustained does most of the work.
Before making a choice, run at least three cases: your base growth assumption, a lower-growth case and a flat-dividend case. Compare the timing of income with the cash you need, then inspect the company's filings to see whether cash generation, reinvestment needs and debt make each path plausible. If the investment only works at the most optimistic growth rate, the income plan has little room for error.
All figures are hypothetical, rounded and pretax. This article is educational, not a forecast or personal investment advice.