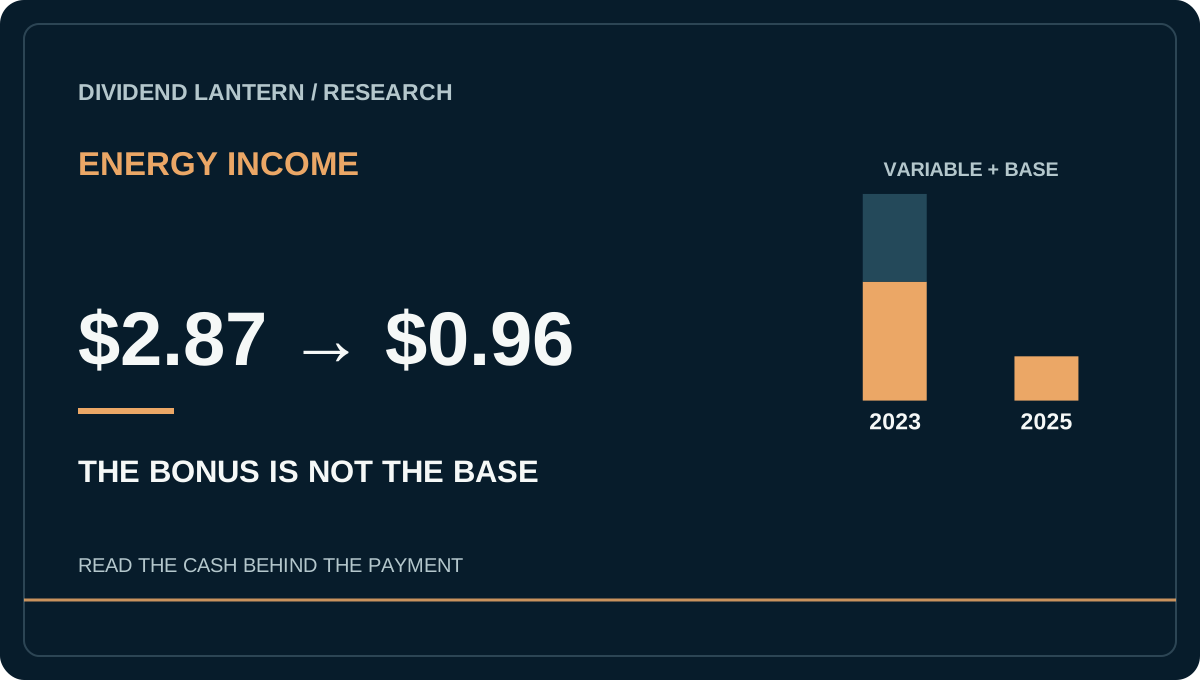
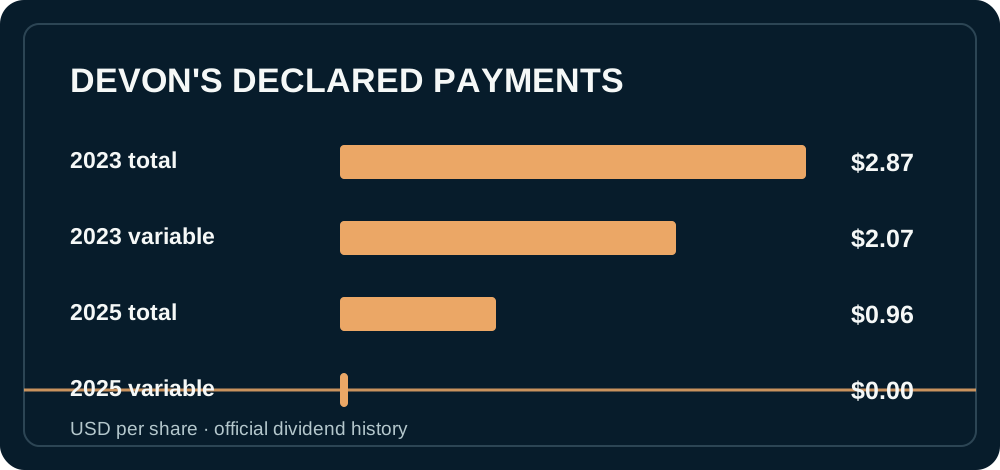
A $2.87 annual dividend became $0.96 two years later. Was it a cut? For Devon Energy, the question has two answers. Its total per-share distributions fell from $2.87 in 2023 to $0.96 in 2025, but the mix changed: the variable component went from $2.07 to zero while the regular component rose from $0.80 to $0.96. A screen showing only “dividend growth” or only “dividend cut” misses the structure. Devon's official dividend history.
Two cash streams with two levels of predictability
The base dividend is the regular quarterly amount the board chooses to maintain, subject to future declarations and business conditions. A variable dividend is an additional distribution linked to a formula or management decision and may move with commodity prices, capital needs, debt reduction or repurchases. Neither is legally guaranteed, but the variable part is specifically designed to change. Devon's dividend policy says the regular payment is reviewed by its board and may change with earnings, cash flow, investment opportunities and financial strength.
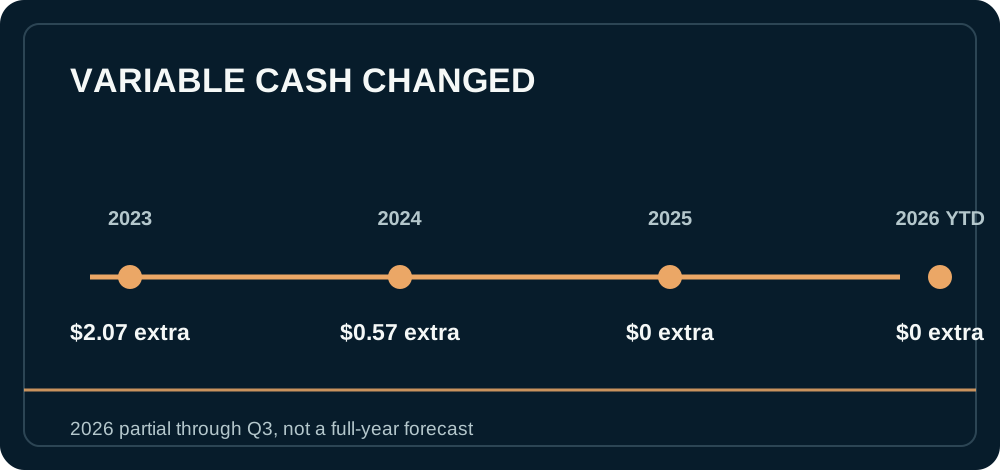
Devon's actual payment history provides a cleaner illustration than a made-up “oil stock” chart. In 2023, it paid $0.80 fixed plus $2.07 variable per share. In 2024, $0.88 fixed plus $0.57 variable. In 2025, $0.96 fixed and no variable. Through the three quarterly payments declared by October 24, 2026, the 2026 tally is $0.88 fixed and no variable, including a base of $0.32 in the second and third quarters. That 2026 number is year to date, not a completed year's total or a promise for the fourth quarter. Devon dividend history.
A yield screen can turn a bonus into a salary
At a particular stock price, a trailing yield divides the prior twelve months of total dividends by today's share price. If the trailing period includes a large variable payment, annualizing it as the coming year's dependable cash overstates household income. The reverse problem also occurs: a trailing period with no variable component may understate a possible upside scenario. Neither figure is a forecast. Present a base-case dividend from the most recently declared regular rate, and treat additional cash returns as an explicit scenario, not an entitlement.
Commodity businesses add a second layer. Oil and gas prices can move faster than operating costs or drilling plans. Capital spending, lease obligations, royalties, taxes and balance-sheet decisions compete with dividends for cash. The appropriate coverage metric is not last quarter's EPS divided by the combined payout. Read the cash-flow statement, the capital budget and the company's own definition of free cash flow. Consider what happens if realized commodity prices fall while fixed costs remain. Devon's annual and quarterly reports provide those facts, but the exact break-even price is not a constant printed on a dividend calendar.
A better way to budget and research
For a hypothetical 100-share position, a $0.32 quarterly base would imply $32 for a quarter if the board declares that rate again. It does not imply any variable payment. A $0.22 variable payment, such as Devon's declared Q3 2024 component, would have added $22 on the same 100 shares for that specific quarter. This arithmetic is illustrative of the declaration, not a future Devon income estimate. Devon dividend history.
Use two tracker fields—regular and special/variable—and never overwrite the former with the latter. Compare a conservative oil-price case, a base case and an upside case. Watch whether management directs surplus cash to debt, repurchases or variable dividends. Most importantly, compare the total return, including share-price changes, not merely the cash received. A large variable payout can coexist with a weak investment outcome if capital value erodes.
The question for the next commodity cycle
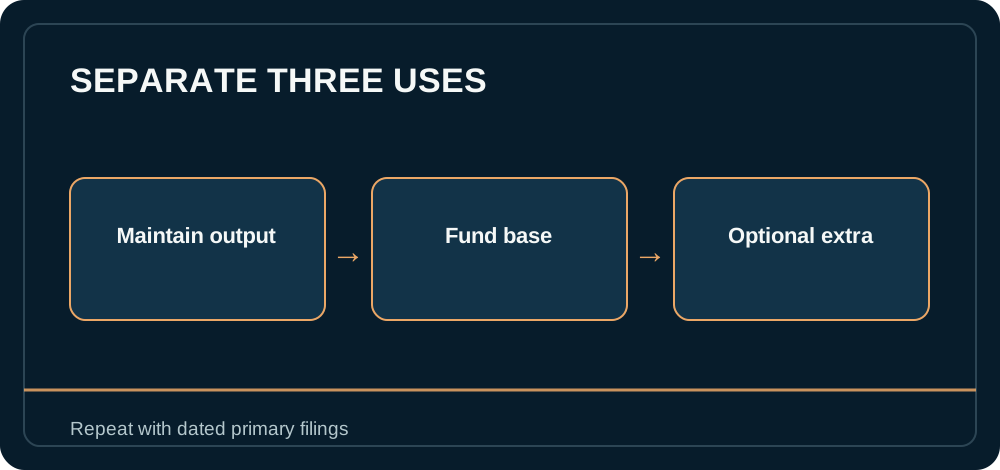
Devon's history illustrates why a dividend tracker needs an explicit payment type column. Its 2023 total payout included more variable than fixed dollars. By 2025 the total was lower even though the regular amount was higher. These facts make it easier to test a forecast: if a scenario assumes a return to the 2023 total, what commodity prices, production, capital spending and board decisions would be required? If a scenario assumes only the regular dividend, is that regular rate covered after the capital needed to maintain output? Neither answer can be inferred from the prior high-water mark. For a diversified portfolio, treat potential variable distributions as a windfall to allocate deliberately rather than as rent-money cash due on a calendar.
Why a dividend chart needs two colors
Imagine a chart that shows only Devon's annual total: $2.87 for 2023 and $0.96 for 2025. The visual suggests a fall of about two-thirds. A second chart showing only the regular component moves in the opposite direction, from $0.80 to $0.96. Both are arithmetically correct, but neither communicates the full distribution policy. The stacked chart above separates the baseline from the optional extra. It tells a household planner that a large piece of historical cash was never intended to be a stable salary, while still acknowledging that the cash actually received in 2025 was materially lower. Devon's dividend history supports each dated component.
This separation matters for evaluating management claims too. A company can say it increased its base dividend while total shareholder cash declines. Another can announce a large variable dividend that creates a headline yield without improving the ongoing base. Ask what portion of the payout is resilient at a weaker commodity price and what portion requires a favorable cycle. Then compare that claim with the actual cash-flow statement and the capital expenditure needed to sustain production. A dividend policy is a framework, not a substitute for those numbers.
Build a conservative income calendar
For each holding, record the latest declared regular per-share payment, the date of that declaration and a separate field for declared variable payments. The calendar can show an indicated regular run rate as a planning assumption, clearly marked as not yet declared for future quarters. It should include variable cash only after a board announcement. On Devon's official payment history, the regular and variable amounts are visible by payment; a tracker that collapses them into one “annual dividend” loses information.
Stress the income plan with a zero-variable case. If expenses require the variable portion, the plan depends on commodity outcomes beyond the investor's control. For portfolio comparison, use three columns: regular yield at the current price, historical total cash yield over a stated period, and a scenario yield under specified price and payout assumptions. These columns answer different questions; combining them into one precise-looking percentage encourages overconfidence. The 2026 year-to-date sum in this article is explicitly partial, so it should not be displayed as a completed-year figure.
Oil prices are only one variable. Natural-gas prices, production mix, drilling productivity, service costs and debt obligations influence free cash flow. A producer can temporarily sustain a payment by reducing investment, but underinvestment may affect future output. Conversely, repurchases or debt reduction can use surplus cash without appearing in dividend totals. Read the company's capital-allocation statements and test what changes if the cycle weakens. The most useful conclusion is often a range of possible cash returns, not a point estimate copied from last year's high payment.
Educational research as of October 24, 2026, not an investment recommendation. Board declarations and commodity prices change. Historical amounts are not forecasts.