
A stock yielding 7% can look like a shortcut to income. Sometimes the business genuinely produces enough cash to support the payout. Sometimes the yield is high because the share price has fallen faster than the market's confidence in the dividend.
The yield alone cannot tell you which situation you are looking at.
Start with the denominator
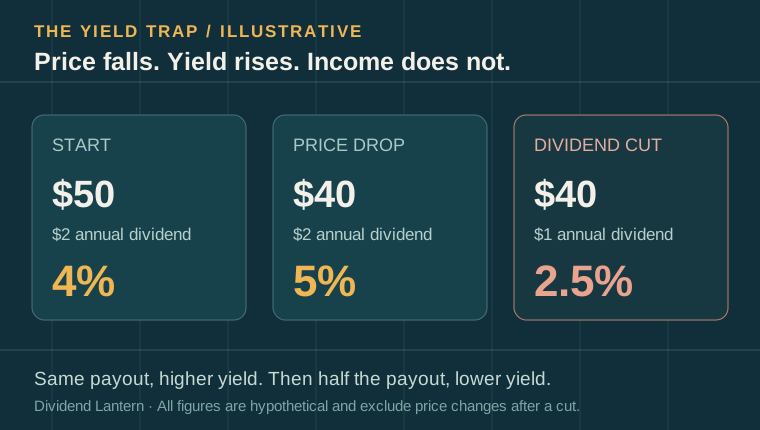
Dividend yield is the annualized dividend per share divided by the current share price. Imagine a company paying $2 per share annually. At a $50 share price, its indicated yield is 4%. If the stock falls to $40 and the dividend remains $2, the indicated yield rises to 5% even though shareholders receive no additional cash. If the board later reduces the annual payout to $1, the yield on that $40 price falls to 2.5%.
That is why a high yield after a sharp selloff should prompt a question: What changed in the business? A lower price may create an opportunity, but the higher yield itself is only arithmetic. Fund investors should be especially careful not to confuse a distribution rate with investment performance; the SEC explains that fund distributions can come from several sources, including return of capital.
Do not confuse today's yield with yield on cost
If you bought at $50 and still receive $2 a year, your yield on the original $50 cost is 4%, even when a quote screen shows a 5% current yield at $40. Yield on cost can describe the income from your purchase, but it does not tell you whether keeping that $40 investment is attractive today. New money and existing capital both have alternatives. Compare the company's current price, risk and expected cash flows with those alternatives rather than treating an old entry price as a safety signal.
Also check what the displayed yield annualizes. A screen may multiply the most recent quarterly payment by four. That is a convenient indicated annual dividend, not a guarantee that the next four payments will be the same. A one-time special dividend can make a trailing twelve-month yield unusually high, while a recent cut can make it stale. Read the issuer's declaration before using the number.
Follow the cash, not just earnings
For an operating company, pull its latest annual report and at least the most recent quarterly filing. The SEC's guide to financial statements explains why the income statement and statement of cash flows answer different questions. Earnings include noncash items and accounting timing; the cash flow statement shows cash generated and spent.
An initial screen is:
Operating cash flow − capital expenditures = a simple free cash flow estimate
Then compare that estimate with cash dividends paid over a comparable period. A hypothetical company with $1.2 billion of operating cash flow, $400 million of capital spending and $600 million of common dividends has $800 million of this simple free cash flow estimate and $200 million left after dividends. That sounds more comfortable than a company with the same dividend bill and only $450 million left after capital spending.
This is a screen, not a verdict. Capital spending may be unusually low for one year. Working capital may temporarily boost operating cash flow. Acquisitions, mandatory debt repayments, pension contributions or preferred dividends can also compete for cash. For banks and certain other financial firms, a generic free cash flow calculation may not be the right analytical tool; use their regulatory capital and industry-specific disclosures instead.
Put a simple stress case beside the base case
The same hypothetical company can look different when operating cash flow is less favorable. Keep the period and units consistent. The stress column below assumes lower operating cash flow and higher capital spending; it is not a forecast of any real business.
| Hypothetical annual cash flows | Base case | Stress case |
|---|---|---|
| Operating cash flow | $1,200m | $900m |
| Capital spending | $400m | $500m |
| Cash after capital spending | $800m | $400m |
| Common dividends paid | $600m | $600m |
| Cash after dividends | $200m | −$200m |
The stress case does not prove that a cut is inevitable. A company may have cash reserves, access to financing or room to reduce other spending. It does show where the claim of dividend safety needs more evidence. Look at several reporting periods to separate a temporary inventory swing or tax payment from a lasting decline in demand. Then read management's explanation alongside the SEC's guidance on the cash flow statement.
Ask what the balance sheet demands next
A dividend can be covered by last year's cash flow and still be under pressure. Read the debt maturity schedule, the cost of refinancing and management's stated spending plans. A company that must refinance heavily at higher interest rates may have less room for dividend growth. The dividend is a board decision, not a bond coupon.
Next, stress-test your conclusion. What happens if revenue falls, margins narrow or cash conversion weakens? If a small setback would push dividends above recurring cash generation, the apparent yield deserves a larger margin of safety.
Debt deserves its own calendar. List maturities over the next two or three years, the cash currently on hand and the undrawn credit available under disclosed facilities. If the company has to borrow to pay a dividend while refinancing existing debt, the dividend is competing with creditors for the same funds. Check whether management can delay discretionary buybacks or expansion projects before assuming that the common dividend is the first item to change.
Finally, separate ability from willingness. A board may have enough cash to maintain the payment but choose to invest elsewhere; it may also maintain a payment for a while despite weak coverage. Public filings and board declarations establish what has happened, not a contractual promise about future common dividends.
Turn the screen into a research note
Write down the reported period, filing date and each source number before deciding that a high yield is attractive. A useful one-page note has the current indicated dividend, the last declared dividend, three years of cash coverage, major debt maturities and one condition that would invalidate your thesis. A note that says only “7% yield” leaves out almost everything that could protect an income investor from a surprise.
If you compare two companies, use the same reporting window and make exceptional cash items visible. The company with the smaller headline yield may have more room to grow its dividend, while the higher yielder may have a durable business and a temporarily depressed price. The answer has to come from business economics and valuation, not from sorting a yield column.
A five-question checklist
- Did the yield rise because the dividend increased, or because the share price fell?
- Has operating cash flow covered capital spending and dividends across several years, not only one quarter?
- Are debt maturities, interest costs or other commitments set to absorb more cash?
- Does management expect to fund growth and dividends from the business, or from borrowing and asset sales?
- Would the investment still make sense if the dividend were flat—or cut?
The strongest income case is one you can explain without leading with the yield. Describe the business, its cash generation and its obligations first. The yield becomes useful only after that work.
Educational analysis, not a recommendation to buy or sell any security. All dollar figures above are hypothetical.