A long dividend history cannot replace a successful medicine. Johnson & Johnson (JNJ) and AbbVie (ABBV) both return substantial cash to shareholders, but their paths to the next decade of dividends differ. AbbVie has had to replace the U.S. exclusivity it lost on Humira. Johnson & Johnson combines prescription medicines with a sizeable medical-technology business, yet it also faces patent competition, acquisition spending and litigation uncertainty. The investor's task is to separate a cash-covered dividend today from a business capable of covering larger dividends after its next product cycle.

This comparison uses the same full year, 2025, for cash-flow coverage. Its reporting cutoff is October 24, 2026: J&J reported Q3 on October 13, while AbbVie has announced Q3 results for October 30. We therefore do not invent AbbVie's September-quarter results or compare J&J's nine months with AbbVie's six months as if they were the same period. J&J Q3 2026 results · AbbVie Q3 earnings schedule
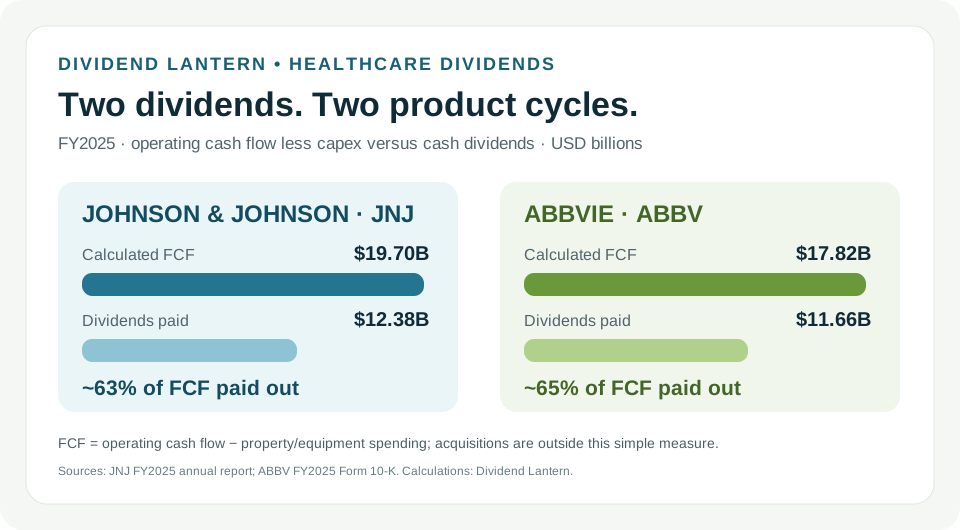
Chart: FY2025, USD billions. Dividend Lantern calculates free cash flow as operating cash flow minus additions to property and equipment from each annual report: J&J $24.530B − $4.832B = $19.698B; AbbVie $19.030B − $1.214B = $17.816B. Dividends shown are cash paid, not dividends declared. FCF excludes acquisition cash flows, which are discussed below. [J&J 2025 annual report](https://www.jnj.com/download/johnson-johnson-2025-annual-report) · [AbbVie 2025 Form 10-K](https://investors.abbvie.com/static-files/c3b8b9e2-9d03-4d72-ad4b-2ae4ac0dedfc).
The 2025 cash test: both passed, neither got a blank check
J&J's 2025 statement shows $24.530 billion of operating cash flow, $4.832 billion spent on additions to property and equipment, and $12.381 billion of dividends paid. On that conventional free-cash-flow definition, the dividend used about 63% of the year's $19.698 billion. AbbVie reported $19.030 billion of operating cash flow, $1.214 billion of property-and-equipment spending, and $11.657 billion of dividends paid: about 65% of $17.816 billion in calculated free cash flow. Both left a cash margin after the regular dividend. The roughly two-point difference is far too small to declare a permanent winner. J&J 2025 annual report · AbbVie 2025 Form 10-K
This is not a full measure of cash available after every strategic choice. J&J spent $17.541 billion on acquisitions, net of cash acquired, in 2025. AbbVie spent $5.237 billion on its filing's category of other acquisitions and investments, net of cash acquired. Those are different accounting categories, so the amounts should not be treated as a direct comparison of acquisition intensity. They do illustrate why a dividend can be covered by free cash flow while the company still borrows, sells assets or uses cash reserves to fund the rest of its plans. J&J's annual report attributes part of its higher year-end debt to financing the Intra-Cellular Therapies acquisition. J&J 2025 annual report · AbbVie 2025 Form 10-K
AbbVie's cash-flow statement also shows $2.865 billion of payments of contingent-consideration liabilities within operating activities for 2025. That is real cash and part of the $19.030 billion operating-cash-flow figure above. Excluding it to make the dividend look even more covered would create a different, adjusted question: whether such payments repeat. We retain it in the historical cash test and ask separately what future acquisition terms might cost. AbbVie 2025 Form 10-K
The businesses behind the cash are not twins
J&J's 2025 reported sales were $60.401 billion in Innovative Medicine and $33.792 billion in MedTech, for $94.193 billion overall. The medical-device business gives it a second major operating engine, though the two segments face distinct reimbursement, regulatory and innovation risks. Within medicines, competition from biosimilars to STELARA weighed on 2025 operational growth even as oncology and other products contributed. Medical technology is not a guarantee against drug patent losses; it is a different source of cash that must earn its own return on invested capital. J&J FY2025 release
AbbVie reported $61.160 billion of 2025 revenue, including $30.406 billion from immunology. Its two newer immunology products, Skyrizi and Rinvoq, generated $17.562 billion and $8.304 billion, respectively. Humira generated $4.540 billion. Together, Skyrizi and Rinvoq were much larger than Humira in that year, evidence that a replacement strategy has produced real sales rather than just a pipeline promise. But the pair also makes future growth sensitive to clinical outcomes, payer decisions, pricing and eventual exclusivity of those very products. AbbVie FY2025 release
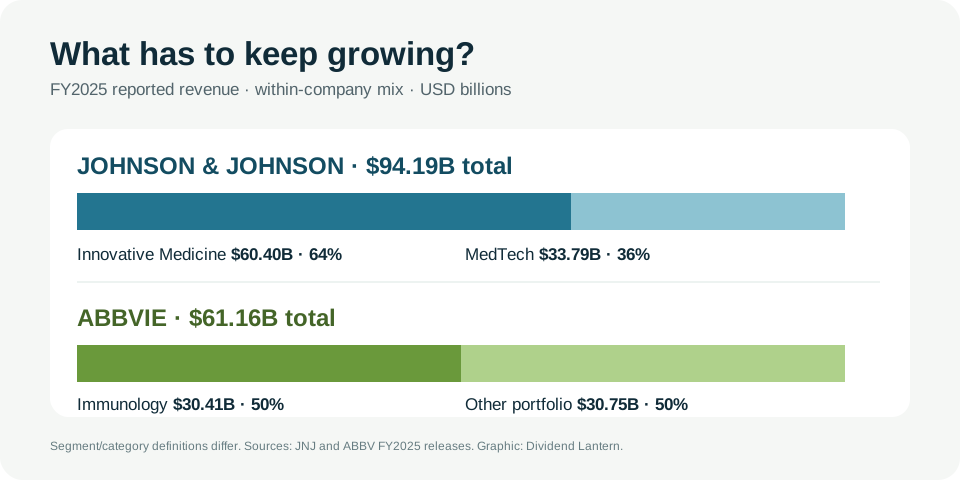
Chart: FY2025 USD billions and rounded shares of each company's own reported revenue. AbbVie's “other portfolio” is total revenue less reported immunology revenue; the segment/category definitions differ, so the bars are not a claim that the businesses have equal diversification. [J&J FY2025 release](https://www.jnj.com/media-center/press-releases/johnson-johnson-reports-q4-and-full-year-2025-results) · [AbbVie FY2025 release](https://investors.abbvie.com/news-releases/news-release-details/abbvie-reports-full-year-and-fourth-quarter-2025-financial).
The dividend record matters, but it is backward-looking. In April 2026, J&J raised its quarterly dividend from $1.30 to $1.34 per share, its stated 64th consecutive year of increases. AbbVie had raised its quarterly rate from $1.64 to $1.73, effective with the February 2026 payment. The dollar-per-share amounts cannot be compared as yields without the contemporaneous share prices. Nor does a higher rate prove that one board has more room to increase it next year. J&J dividend announcement · AbbVie dividend announcement
Debt, special items and what “adjusted earnings” omit
J&J ended 2025 with a stated $47.9 billion total debt balance, up from $36.6 billion one year earlier, reflecting acquisition financing in part. AbbVie's 2025 filing shows $64.503 billion of contractual long-term debt principal, with $6.0 billion due in 2026 under that maturity table. These are different balance-sheet and contractual definitions; subtracting them from an identical revenue or earnings denominator would mislead. The useful questions are how much debt must be refinanced, at what cost, and how much cash remains after interest, dividends and investment. J&J 2025 annual report · AbbVie 2025 Form 10-K
J&J's newly released Q3 2026 results illustrate why EPS alone is a poor dividend-safety headline. Reported diluted EPS was $0.09, affected by a one-time special charge for a proposed talc-litigation resolution, an acquisition and a collaboration. Adjusted EPS was $2.59, but that non-GAAP figure is not cash and the legal obligation cannot be dismissed merely because it is labelled special. J&J also described nine-month free cash flow of approximately $15.1 billion in its release, estimated as of October 13, and a full-year free-cash-flow outlook of about $21 billion; neither is a completed FY2026 result. J&J Q3 2026 release · J&J Q3 prepared remarks
AbbVie's latest released quarter as of this article is Q2 2026. It reported $16.990 billion of revenue, including $5.505 billion for Skyrizi and $2.525 billion for Rinvoq. Those product sales support the transition story, but its next cash-flow and debt details were not yet available for Q3. The company has scheduled that report for October 30. Inventing a nine-month cash-flow comparison now would give the reader false precision. AbbVie Q2 2026 release · AbbVie Q3 schedule
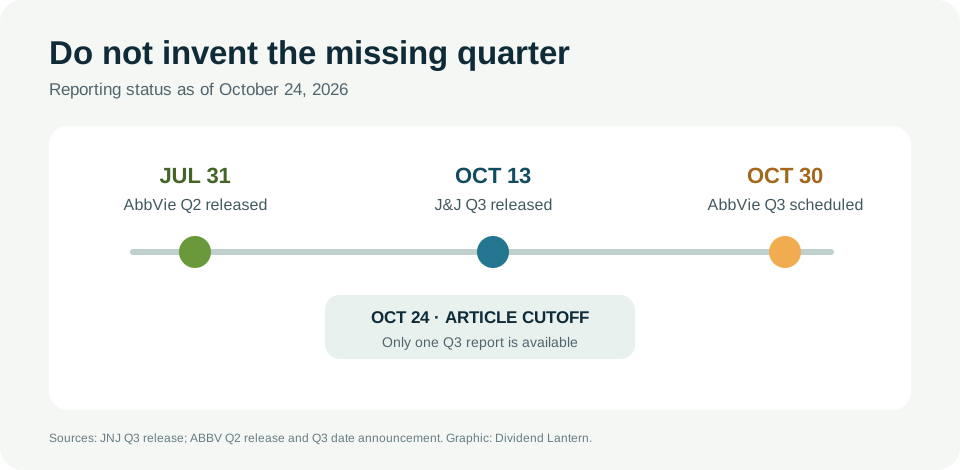
Timeline: facts available October 24, 2026. J&J Q3 has been released; AbbVie Q3 is scheduled, not reported. [J&J Q3 release](https://www.jnj.com/media-center/press-releases/johnson-johnson-reports-q3-2026-results-raises-2026-guidance) · [AbbVie Q2 release](https://investors.abbvie.com/news-releases/news-release-details/abbvie-reports-second-quarter-2026-financial-results) · [AbbVie Q3 schedule](https://investors.abbvie.com/news-releases/news-release-details/abbvie-host-third-quarter-2026-earnings-conference-call).
A watchlist for the next decision
- At AbbVie's October 30 release: compare Skyrizi and Rinvoq sales growth with total immunology growth, then examine operating cash flow, capital spending, contingent payments, dividends and debt after the next quarter. Product sales alone do not pay a dividend if acquisition and development demands outrun cash generation.
- For J&J: separate recurring operating cash from acquisition and litigation outflows. Check the final filed nine-month cash-flow statement against the estimated figure in the October release, and revisit the proposed talc resolution rather than assuming that adjusted EPS settles its cash cost.
- For both: review major-product exclusivity and pipeline evidence, refinancing maturities and the market price at which you might invest. Compare dividend yield only at the same point in time and with taxes and risk in mind.
Our reading: the 2025 cash-flow statements show both companies covered their regular dividends after property-and-equipment spending. J&J has a major MedTech business alongside medicines; AbbVie has produced impressive actual sales from the products replacing Humira. Neither observation eliminates patent, legal, acquisition or debt risk. A fair dividend comparison today must wait for AbbVie's Q3 filing before pretending to score the two companies on the same 2026 period.
Educational research using public company reports available October 24, 2026, not personalized investment advice. Free cash flow is a calculated non-GAAP measure; acquisition cash flows sit outside its simple definition. Adjusted EPS and forward guidance are not cash already earned. Future dividends are subject to board approval.