A REIT can cover this year's dividend while next year's leases quietly approach expiry. AFFO per share is useful, but it reflects a period of collected rent and company-defined adjustments. Lease expirations describe how much rental income must be retained, repriced or replaced in the future. For a property owner, a dividend-safety review needs both views.

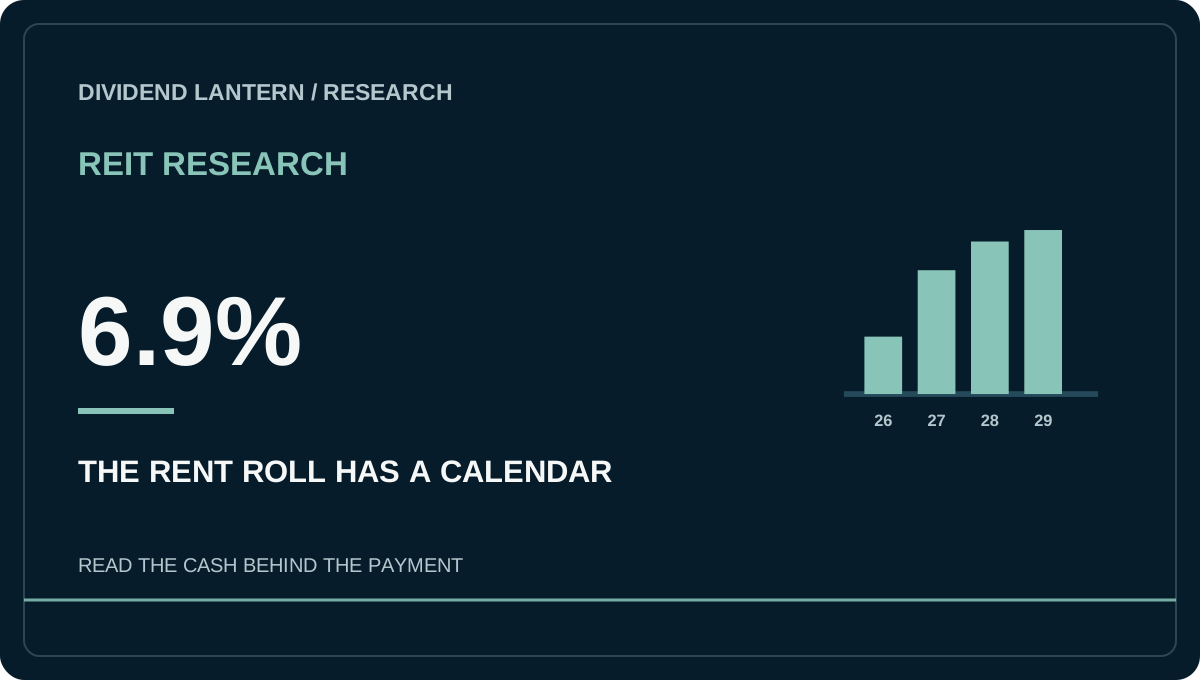
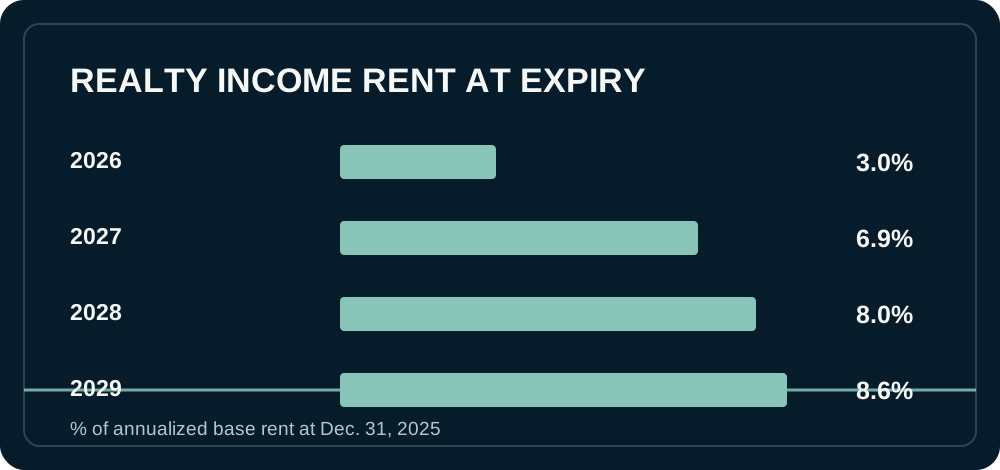
Realty Income makes the process concrete. Its Q4 2025 supplemental report filed with the SEC listed $5.31 billion of annualized base rent across the portfolio at December 31, 2025. Leases scheduled to expire in 2026 represented 3.0% of that rent; 2027 represented 6.9%; 2028, 8.0%; and 2029, 8.6%. These are dated contractual expirations, not a forecast that the rent will disappear. Tenants may renew or be replaced, while some leases may be terminated or restructured earlier.
Why count rent dollars, not just buildings
One large industrial lease can contribute more rent than many small retail spaces. A raw number of expiring leases hides that economic difference. Realty Income's table provides both the lease count and the percentage of annualized base rent represented by each expiry year. A dividend investor should prefer the rent-weighted view, then inspect whether the exposures are concentrated in a single tenant, location or industry. Realty Income Q4 2025 supplement.
The company's 2025 Form 10-K explains that most properties are leased under net-lease agreements in which clients typically bear certain property costs. It also notes rent increases can be fixed, inflation-linked with ceilings, or tied to tenant sales. A contractual rent escalator can help an operating portfolio, but it cannot rescue a tenant that stops paying. The relevant questions at renewal are who will occupy the property, at what rent, after how much downtime and cost?
A hypothetical vacancy stress test
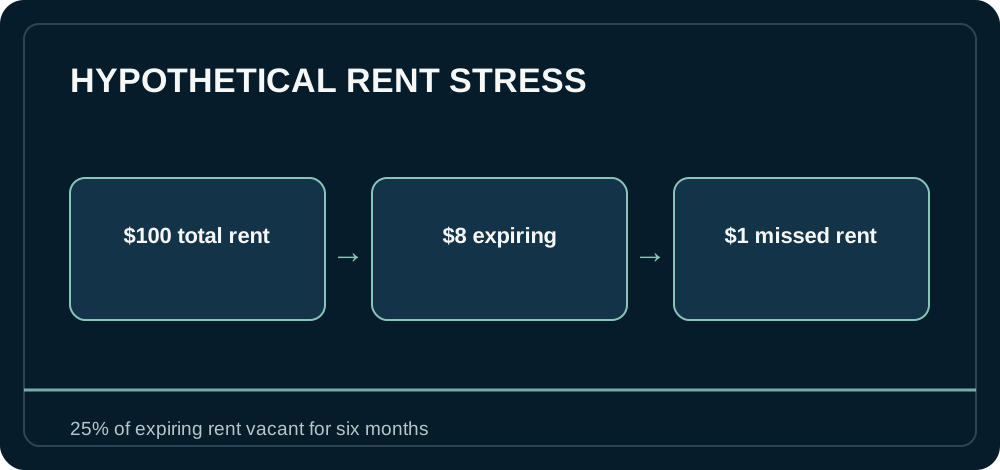
Suppose a REIT has $100 of annual rent and $8 is tied to leases expiring over a year. If one-quarter of that expiring rent goes vacant for half a year before replacement, the lost rent is $1: $8 × 25% × ½. This deliberately simplified arithmetic omits rent changes, tenant improvements, leasing commissions, property-level costs and debt service. It is not a forecast for Realty Income. Its value is to turn a lease calendar into a cash question that can be stress-tested.
At each quarter, compare what actually happened to the earlier expiry schedule. Realty Income's supplement reports re-leasing activity and cash-rent recapture rates. Read how much rent was renewed with the same tenant, how much required a new tenant, the average vacancy time and any incentives. A headline recapture rate above 100% does not alone settle the economics if expensive improvements or long downtime were needed. AFFO definitions differ among REITs, so trace what the company deducts for recurring capital needs. Also check debt refinancing and share issuance: growing properties can raise absolute rent while diluting per-share AFFO.
A compact REIT dividend review
- Plot rent-weighted expirations by year and identify the largest tenant and industry exposures.
- Compare renewal and re-leasing outcomes with the prior schedule; separate cash rent from straight-line accounting rent.
- Subtract realistic tenant incentives, downtime and maintenance from the apparent rent growth.
- Compare the resulting per-share cash capacity with the current dividend, debt maturities and financing costs.
This is how a lease calendar becomes a dividend tool. A covered dividend today is evidence about today. The expiration schedule shows where next year's evidence will come from.
What changes the apparent risk
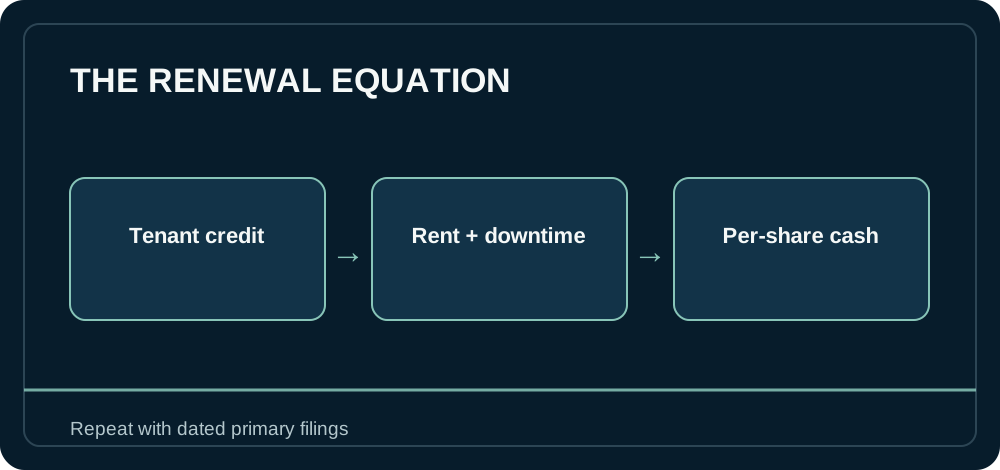
The same 8% of rent scheduled to expire can imply very different cash outcomes. A healthy tenant in a property with strong alternative demand may renew with little interruption and higher cash rent. A specialized building with a weak tenant may require months of vacancy and expensive fit-out before a replacement begins paying. Rent-weighted expiry tables identify the timing but not the probability of those paths. Track tenant concentration and property type alongside the schedule. Also distinguish an option to extend from a binding commitment; Realty Income's table excludes extension options in its stated expiry calculation. The next quarterly supplement is a reality check: compare completed renewals and dispositions with what the prior calendar suggested, then update your dividend stress case rather than preserving a stale lease schedule.
From expiration percentage to per-share cash
The rent-expiry bars in the graphic are a starting exposure, not a loss estimate. To turn one bar into a cash scenario, multiply the rent at expiry by an assumed nonrenewal share, expected vacancy duration and the change in rent after reletting. Then deduct tenant improvements, leasing commissions and carrying costs that fall on the landlord. A portfolio with a 6.9% scheduled rent expiry in 2027 would not automatically lose 6.9% of its revenue. Many tenants can renew. Equally, a full renewal count does not guarantee unchanged economics if incentives or rent concessions rise. Realty Income's Q4 2025 supplement provides the dated expiry mix; the scenario assumptions belong to the analyst and should be labeled as such.
Consider two hypothetical properties contributing the same $1 million of yearly rent. One is a general-purpose building in a deep tenant market, the other requires specialized equipment. If each tenant leaves, a six-month downtime produces the same $500,000 rent gap before expenses, but the second property may need substantially more capital to attract a replacement. This is why property type and local demand matter beside portfolio-wide averages. A high aggregate occupancy rate can obscure a few expensive vacancies, while a temporary vacancy can be manageable if the balance sheet and diversification are strong.
Do not confuse contractual and economic rent
REIT filings can present cash rent, straight-line accounting rent and annualized base rent in different places. These measures serve different purposes. A lease with scheduled future increases can produce accounting revenue that does not match today's cash collection. A dividend is ultimately paid in cash, so an investor should bridge the headline rent metric to operating cash flow and the REIT's own AFFO reconciliation. The Realty Income 2025 10-K describes lease terms and the business model; its quarterly supplemental tables add operational detail.
The lease schedule also interacts with financing. If debt must be refinanced just as a large group of leases resets, higher interest expense can absorb an otherwise healthy rent increase. New equity can fund acquisitions, but the cash benefit must be evaluated per share after dilution. A covered dividend calculated from last year's AFFO per share is useful historical evidence; the combined renewal and financing calendar tests whether that margin may persist.
Keep a dated scorecard. At each quarter, write down the coming one-to-three-year rent expirations, the disclosed tenant concentration, observed re-leasing results, cash-rent recapture, recurring property costs, debt maturities and AFFO per share. Compare the new disclosure with the preceding scorecard rather than only with a long-term average. That process makes a REIT dividend analysis repeatable and exposes deterioration early, without pretending the expiry table alone predicts a cut.
Educational analysis, not a recommendation to buy Realty Income. Portfolio values and lease schedules are dated December 31, 2025 and can change with transactions. Hypothetical stress values are not company forecasts.