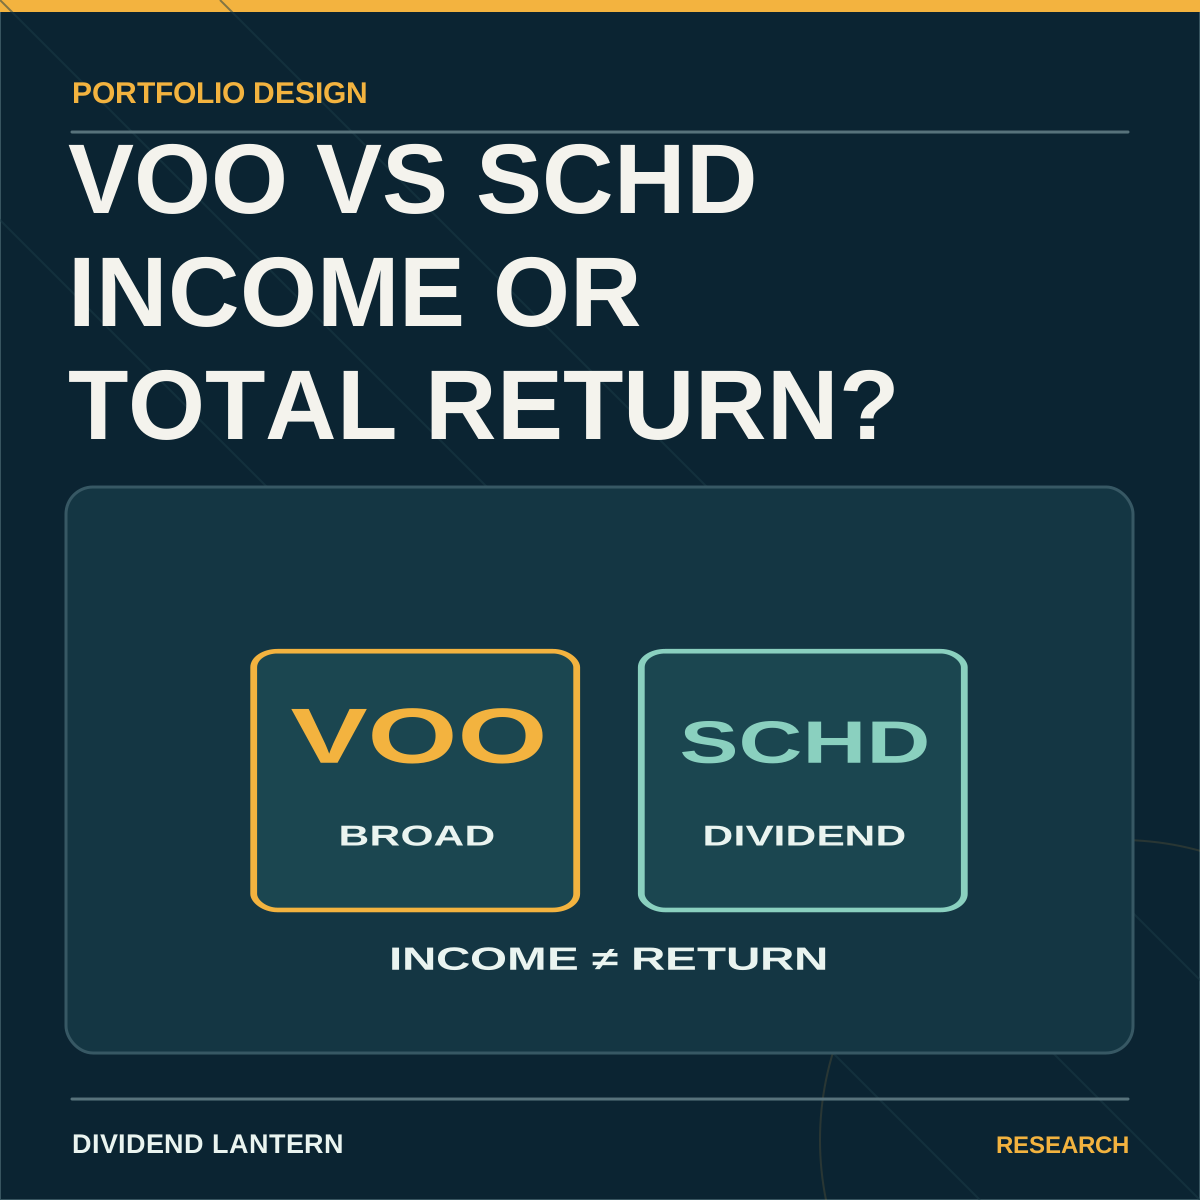
“Which ETF pays me more?” is an incomplete question. A fund can send more cash today while growing the account less, or send less cash while allowing an investor to sell a small amount of shares to fund spending. The relevant comparison is the whole portfolio: what it owns, what it costs, the cash it distributes, how its value changes, and the risks of the withdrawals you plan to make.

Two familiar U.S. ETFs make this concrete. VOO is Vanguard's S&P 500 ETF. SCHD is Schwab's U.S. Dividend Equity ETF. Both are stock funds, but they follow different indexes and select companies for different reasons. This article is an analytical framework, not a claim that one is the permanent winner. Fund compositions, yields and prices change; any actual purchase should use the current prospectus and holdings, not a fixed chart.
Start with the rules, not the latest yield
Vanguard's April 28, 2026 prospectus states that VOO seeks to track a benchmark of large-capitalization U.S. stocks and lists 0.03% in total annual fund operating expenses. Vanguard identifies that benchmark as the S&P 500 Index on its VOO fund page. A broad-market fund owns companies that pay little or no dividends as well as established payers. It is not designed to maximize current cash distribution.
Schwab's SCHD fund page states that the ETF seeks to track, before fees and expenses, the Dow Jones U.S. Dividend 100 Index and lists a 0.06% total expense ratio. The fund prospectus filed with the SEC describes an index of dividend-paying U.S. companies selected for fundamental strength relative to peers. This is a more specific dividend-oriented mandate. It can create different sector and factor exposures from a broad S&P 500 fund.
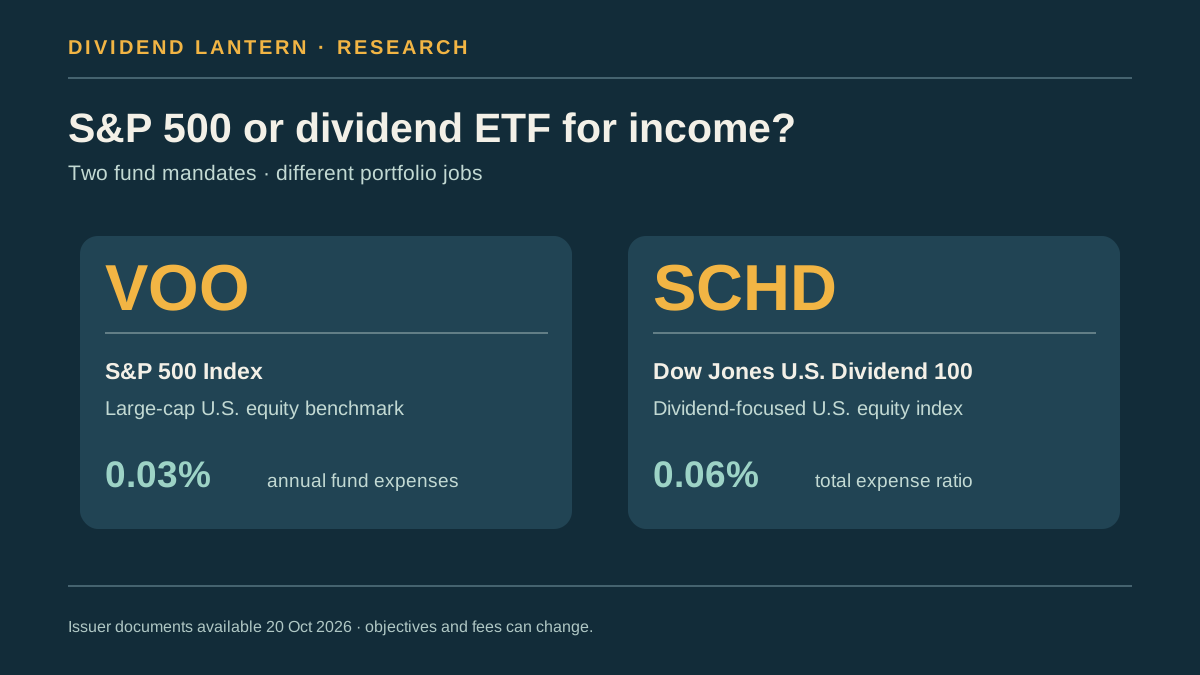
The fee difference is 0.03 percentage point. On a hypothetical constant $100,000 invested for one year, that corresponds to about $30 before compounding, asset changes or other costs. Fees matter over time, but a tiny fee gap should not be used to ignore substantially different investment strategies. Brokerage commissions, bid–ask spreads and taxes can add costs outside a quoted expense ratio. Both funds may hold some of the same companies, so buying both does not automatically double diversification. Inspect current holdings and sector weights.
What cash does—and does not—tell you
The SEC warns that fund distributions are not the same as performance. When an ETF pays a distribution, its net asset value typically falls by roughly the amount paid, all else equal; the investor has exchanged fund value for cash. A higher cash payout is not extra wealth created on the payment date. The fund can also experience gains or losses from the underlying stocks before and after that date.
To isolate the idea, imagine two hypothetical funds, each starting at $100,000 and each earning the same 8% one-year total return before investor taxes. Fund A distributes $1,000 and appreciates $7,000. Fund B distributes $3,000 and appreciates $5,000. Both end with $108,000 of value including distributions. These are teaching numbers, not VOO or SCHD yields or forecasts. Their actual returns will differ, and the two strategies can perform very differently across market regimes.
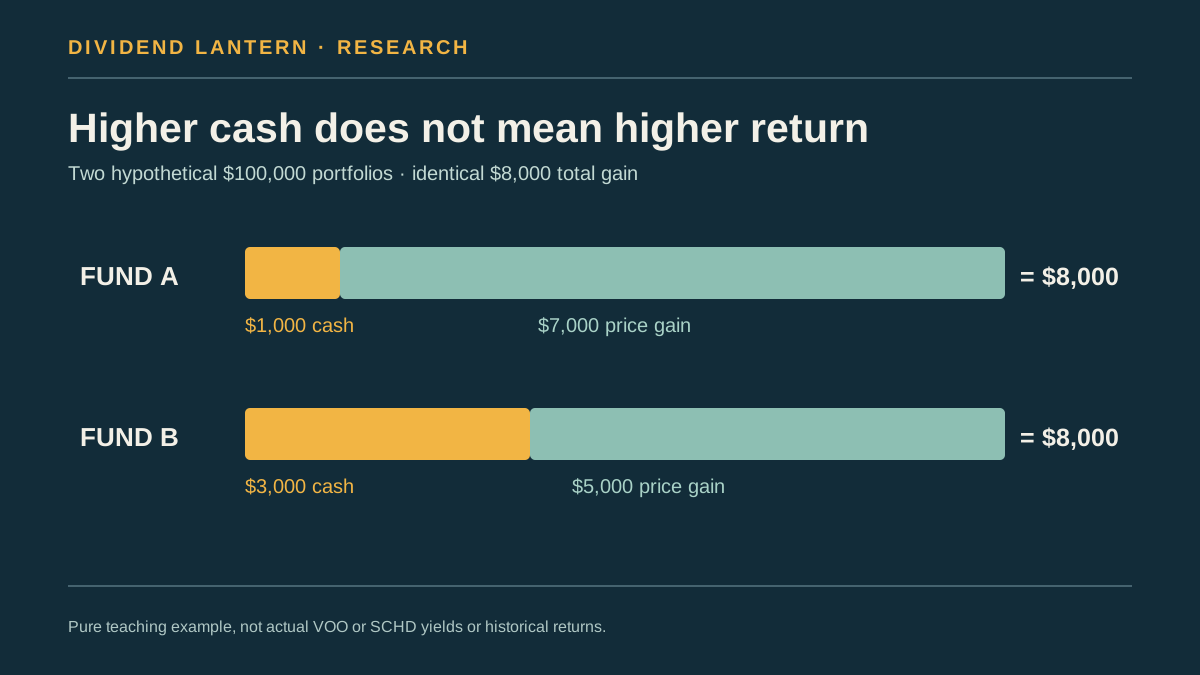
The investor who needs $4,000 after that year could keep Fund A's $1,000 distribution and sell $3,000 of shares. The Fund B investor could keep $3,000 and sell $1,000. Under the deliberately equal-return, no-tax, no-fee assumptions, both withdraw $4,000 and retain $104,000. A share sale is not a moral failure or a free lunch; it is another way to convert portfolio value to cash. The timing and market price of the sale matter, especially during a downturn. Taxes may differ materially.
The real tradeoffs behind the toy model
Sequence risk matters to anyone drawing income. If the market declines early in retirement, selling shares to cover bills can require selling more units at low prices. A higher-distribution ETF reduces the amount that must be sold only if the distribution persists; it does not remove equity market risk. A fund concentrated in slower-growing dividend sectors can also lag during periods when other sectors drive market returns. Conversely, a market-cap-weighted fund may be heavily exposed to a small set of very large companies. Use current holdings rather than permanent labels such as “safe” or “growth.”
Distribution stability differs from stock-level dividend history. An ETF passes through cash generated by a changing collection of holdings, less expenses, and may make other distributions. The amount per fund share can vary from quarter to quarter. Do not multiply the last distribution by four and call it guaranteed annual income. The SEC advises reading the fund's prospectus for policy and checking the source of distributions. It also warns that some funds can distribute return of capital, which is not the same as portfolio earnings and affects basis. SEC fund distributions bulletin.
Tax treatment can change the after-tax answer. In a taxable U.S. account, fund distributions may be taxable even when reinvested; selling shares can trigger a capital gain or loss depending on basis and holding period. Qualified dividends, nonqualified dividends and capital gains are not interchangeable. In a tax-advantaged account, the immediate tax mechanics may differ. This is a reason to compare after-tax cash needs, not a universal argument for either fund. SEC bulletin on fund distributions and taxes.
Diversification is more than a count of tickers. SCHD's dividend-selection rules may tilt it toward certain industries or styles. VOO's large-cap index can also become concentrated when a few companies represent much of the market. The SEC reminds investors that holding several funds does not ensure diversification if their holdings overlap. Compare sector allocations and top holdings on the same date; repeat after major index reconstitutions. SEC diversification guide.
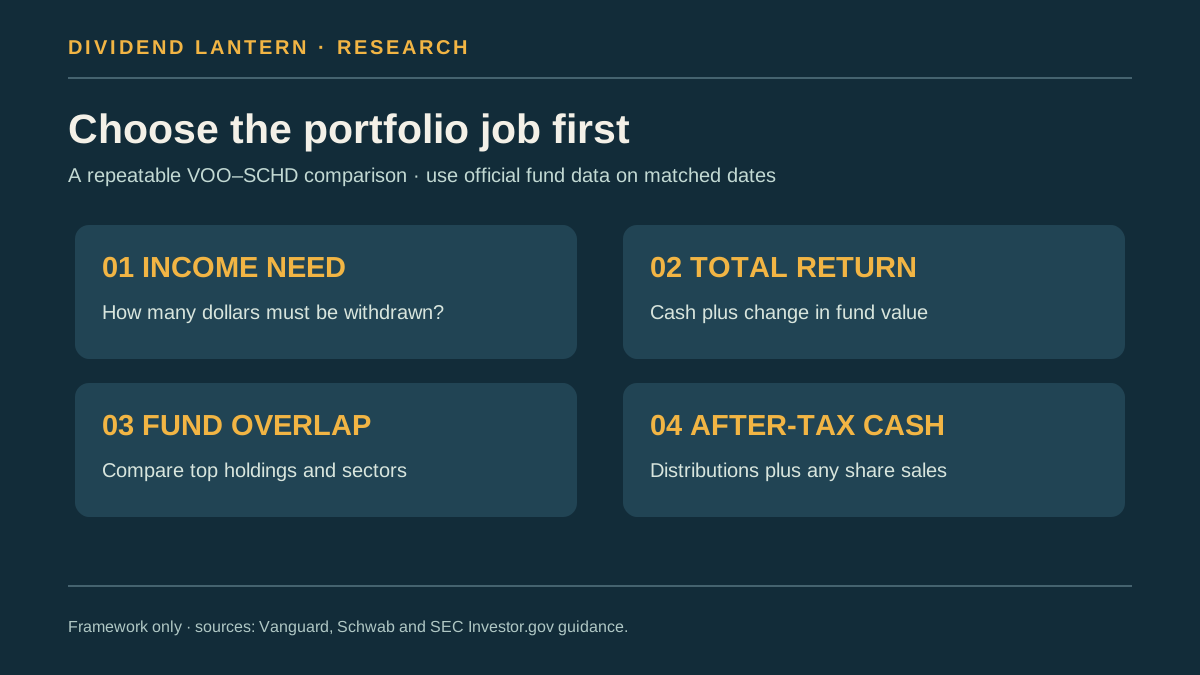
A four-step comparison you can actually repeat
- Define the job. Is the money being accumulated for a distant goal, or do you need a specified dollar withdrawal now? An investor reinvesting everything has a different cash-flow problem from one paying expenses.
- Use matched dates and definitions. On the same day, record each fund's official 30-day SEC yield, trailing distributions, expense ratio, holdings and standardized total returns. Yield measures are not identical; label which one you use. Avoid splicing a September yield from one fund to a July figure from another.
- Model the withdrawal. Estimate cash distributions conservatively, then calculate any share sales needed to reach the annual spending goal. Stress-test a down market and a lower distribution. Include a cash reserve and the taxes relevant to your account.
- Check the combined portfolio. If you hold both funds, measure overlap and sector concentration. Two ticker symbols do not automatically represent two independent sources of return.
This process may end with one fund, both funds, or neither. An investor focused on current cash may value SCHD's dividend-oriented design; an investor focused on broad large-cap exposure may prefer VOO's mandate. Those preferences do not predict which will earn more from today's price. The point is to choose a portfolio job before choosing the fund that looks best in one yield screenshot.
This article is educational and not personalized investment or tax advice. Expense ratios and fund objectives are documented as of October 24, 2026; verify current fund documents before acting. Every $100,000, $8,000 and withdrawal example is hypothetical. VOO and SCHD are discussed independently; neither issuer endorses Dividend Lantern.