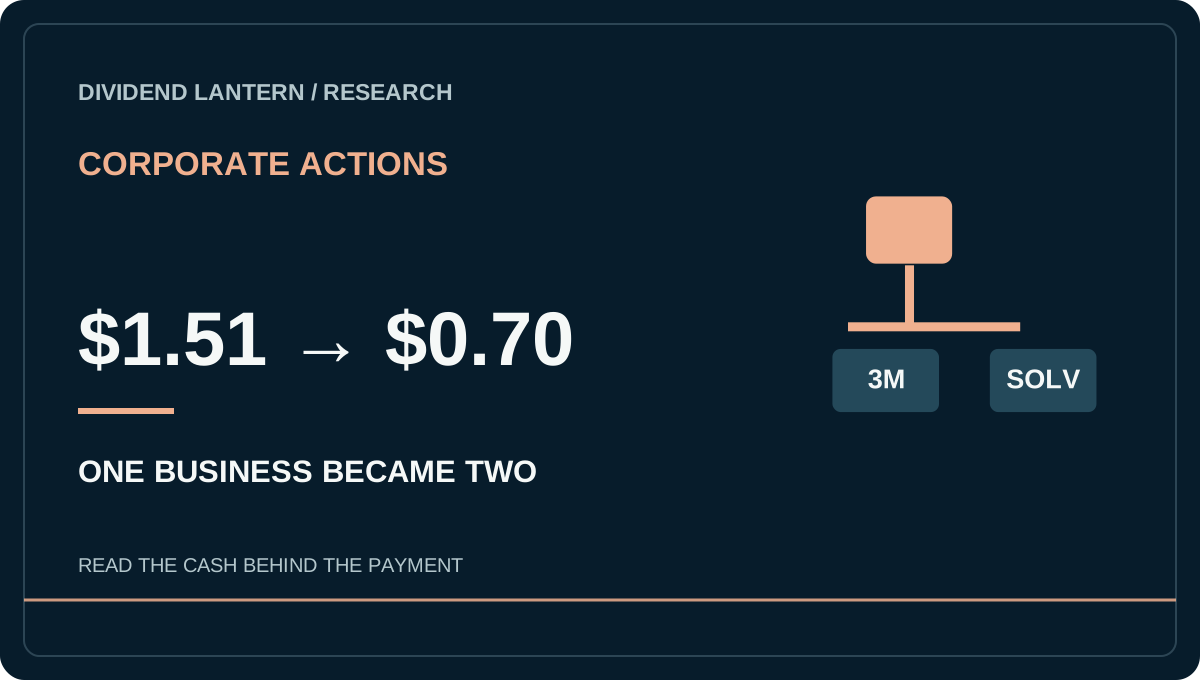
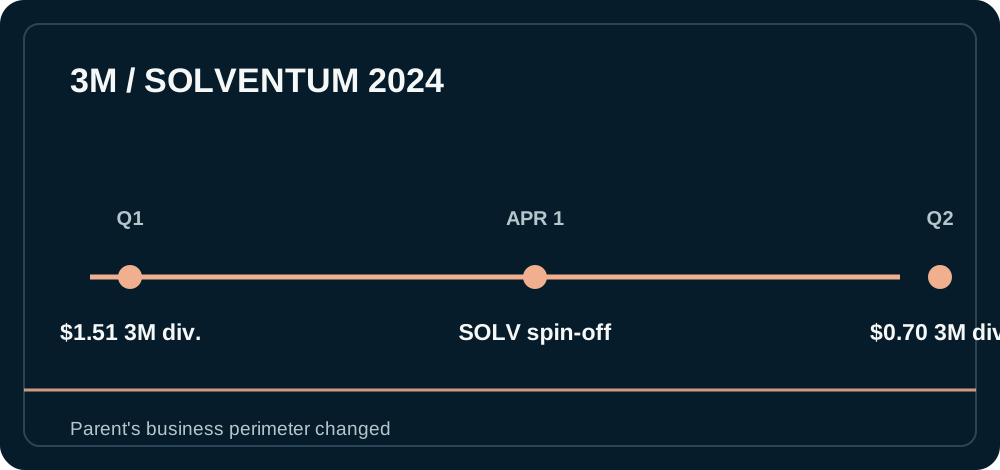
A dividend chart shows 3M going from $1.51 to $0.70 per quarter in 2024. It does not show the whole transaction. On April 1, 2024, 3M completed the separation of its health-care business into Solventum. Shareholders of record received one Solventum share for every four 3M shares. The parent company subsequently reset its own quarterly dividend. Treating the pre- and post-separation 3M payments as if they came from the same business and assets hides the crucial change in what shareholders owned. 3M spin-off completion · 3M 2024 Form 10-Q.

One investment became two securities
The spin-off removed a material business from 3M's consolidated operations. 3M's pro forma filing explains the distribution of 80.1% of Solventum and the one-for-four share ratio. After the separation, 3M no longer consolidated Solventum's revenue, profit and cash flows. The shareholder held a different portfolio: their existing 3M shares plus newly received SOLV shares, subject to any later trading choices. The economic value of the spin-off stock and its separate future dividend policy have to be considered; one cannot compare the old and new parent dividend as an isolated unchanged enterprise.
3M's 2024 10-Q states that the board declared $1.51 per share for Q1 2024 and $0.70 for Q2 after the spin. Its May 2024 dividend declaration confirms the $0.70 payment. This was a real reduction in the cash paid by 3M per 3M share. The spin-off context helps explain the reset; it does not magically replace the missing parent cash or guarantee SOLV dividends.
What to compare instead of the old yield
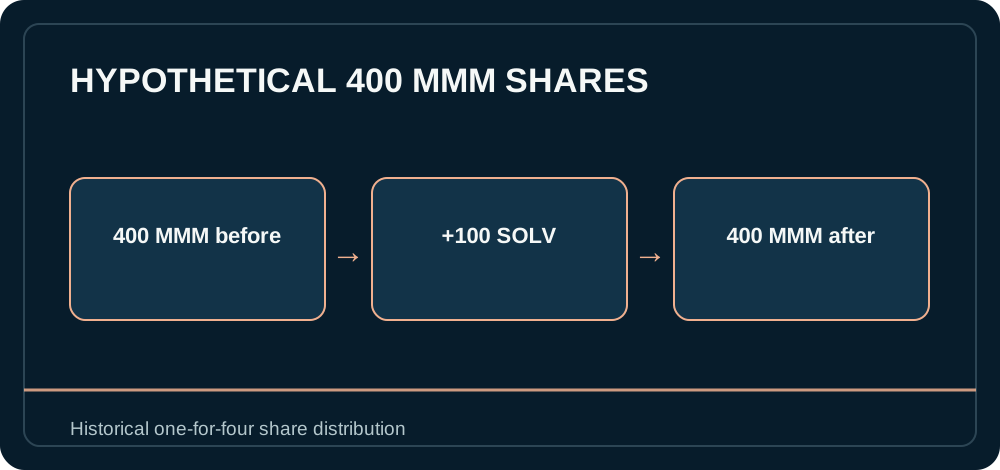
Imagine an investor held 400 shares of 3M through the record date. Under the announced ratio, they received 100 SOLV shares, in addition to retaining 400 3M shares. Before the spin, a $1.51 3M quarterly dividend would correspond to $604 on 400 shares if eligible. At the new $0.70 rate, 400 3M shares correspond to $280 for a declared quarter. These are simple historical share-count examples, excluding taxes, price moves, fractional share handling and any Solventum cash distributions. They do not establish that the combined investment gained or lost $324 in wealth. 3M distribution announcement · 3M dividend release.
The right research question is what each standalone company can distribute after its own capital needs, debt obligations and reinvestment. Examine the post-spin balance sheets and cash-flow statements. Check any debt allocated to the separated business, one-time separation costs and continuing commercial agreements. Use pro forma historical results to understand the new perimeter, but remember a pro forma statement is a reconstruction, not cash already received by the parent company after separation.
A four-step corporate-action audit
- Save the distribution ratio, record date and effective date from the issuer announcement.
- Build a post-spin statement for each company, including debt and cash—not merely the legacy parent's trailing dividend yield.
- Review each board's actual dividend declarations. Do not assume the child will replace a parent payment.
- Compare total shareholder value, including both securities and all cash received, against a properly adjusted historical baseline.
A spin-off can create two healthier focused businesses or expose weakness in one or both. The dividend reset is neither automatically a bargain nor automatically a permanent loss. It is a signal to rebuild the model around the assets shareholders actually own.
Avoid a misleading before-and-after chart
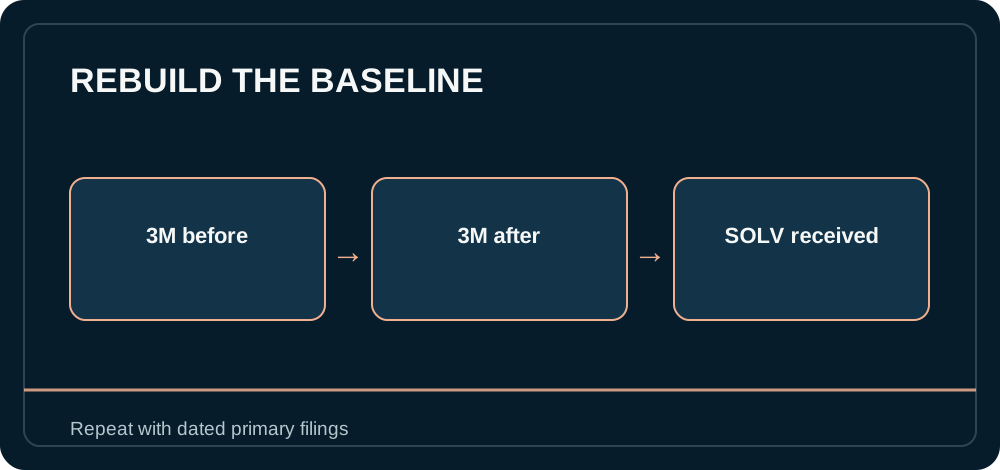
An unadjusted chart of MMM's parent dividend per share treats the pre-spin and post-spin company as identical. An equally weak chart adds an imagined Solventum dividend to the new parent rate. The child company's board is separate and may prioritize debt reduction or reinvestment; its share-price value is not a cash payment. To compare investor outcomes, keep a transaction ledger that records the date and number of SOLV shares received, any cash in lieu of fractions, later declarations from each board and both market prices. For operating analysis, use 3M's pro forma statements to approximate the remaining business and then verify with actual post-spin reports. The corporate action creates a new research starting point rather than a simple continuation of a dividend streak.
Separate income loss from value transfer
For the hypothetical 400-share holder, the parent cash payment at the historical Q1 and Q2 rates moves from $604 to $280 for one declared quarter. That is a $324 difference in parent-company cash, not a calculation of investment loss. The same holder received 100 shares of Solventum under the one-for-four distribution terms. Those shares had their own market value and future risks. An investor who sold SOLV immediately could turn that value into cash; one who held it would retain exposure to a separate business. Neither choice reconstructs the old 3M dividend automatically.
The distinction matters in a dividend tracker. A tracker that records only the changed MMM dividend will correctly show lower ongoing MMM income but may incorrectly imply that the shareholder received nothing else. A tracker that adds the market value of SOLV as “dividend income” makes the opposite error: stock distributed in a corporate action is not a recurring cash paycheck. It needs its own holding, cost-basis record and later cash-payment history. The investor's cost-basis allocation and tax treatment require the issuer's tax information and the investor's circumstances; a simple social-media chart cannot calculate them.
What an adjusted historical comparison would require
To compare the ongoing parent business with its predecessor, remove the divested segment's historical operations and consider the transaction's debt, cash and continuing agreements. 3M's pro forma financial statements were prepared for this kind of comparison. They are still pro forma, so later actual results must be checked. An apples-to-apples dividend coverage chart would use post-spin 3M operating cash flow and capital needs against post-spin 3M cash dividends. A second analysis would examine SOLV as an independent security. Summing the two companies' future dividends before the child has declared one would manufacture a payment.
The share-price chart needs similar care. A stock normally adjusts when assets are distributed, and market providers may display historical prices with or without corporate-action adjustments. A vertical drop on the parent's raw share-price series around a spin date is not necessarily destruction of wealth. To estimate the original shareholder's total return, combine the value of MMM shares, SOLV shares and actual cash received at each measurement date. Note any sales and taxes separately. Do not compare a pre-spin parent-only price with a post-spin parent-only price and call the difference a dividend verdict.
More generally, a long dividend streak can survive a transaction as a brand story while the underlying business perimeter changes. Or a streak can formally end despite a shareholder receiving a valuable new company. The question for an income investor is what the remaining assets can pay repeatedly, after financing and reinvestment, and whether the distributed child adds a separate source of durable cash. That is a fresh underwriting exercise, not a vote on a streak graphic.
Educational corporate-action analysis, not a recommendation regarding MMM or SOLV. Historical declaration and distribution facts are as of the linked 2024 primary documents; later dividends are not assumed.