
An earnings release says a company's free cash flow covered its dividend. That sounds reassuring. But was the cash produced by the business repeatedly, or did one quarter benefit from collecting old receivables and postponing purchases? Does the company's definition include all the investment needed to keep operating?
For a conventional operating business, free cash flow is a useful starting point. It is not a certificate of dividend safety. The SEC's guidance on non-GAAP measures says companies commonly calculate it as cash from operating activities minus capital expenditures, but definitions are not uniform. The SEC also cautions against implying that this result is all available for discretionary spending: debt service and other required uses of cash may remain.
Here is a practical four-step test you can repeat after each annual report.
1. Rebuild the number from the cash-flow statement
Start with net cash provided by operating activities in the audited annual statement of cash flows. Subtract cash spent on property and equipment. Some businesses also need to invest in software or other long-lived assets; read the labels before deciding what belongs in your comparison. Write your exact formula beside the result.
The SEC's guide to financial statements explains why cash flow differs from reported profit: the operating section adjusts for noncash items and movements in operating assets and liabilities. The investing section shows purchases of long-lived assets, while the financing section includes cash raised or returned to capital providers. A dividend is a cash outflow even if the income statement shows plenty of profit.
Use the same period for every number. Comparing a full year of free cash flow with the most recent quarter's dividend—or comparing a projected dividend with last year's cash generation—can create false comfort. For each figure, note whether it is reported, annualized or forecast.
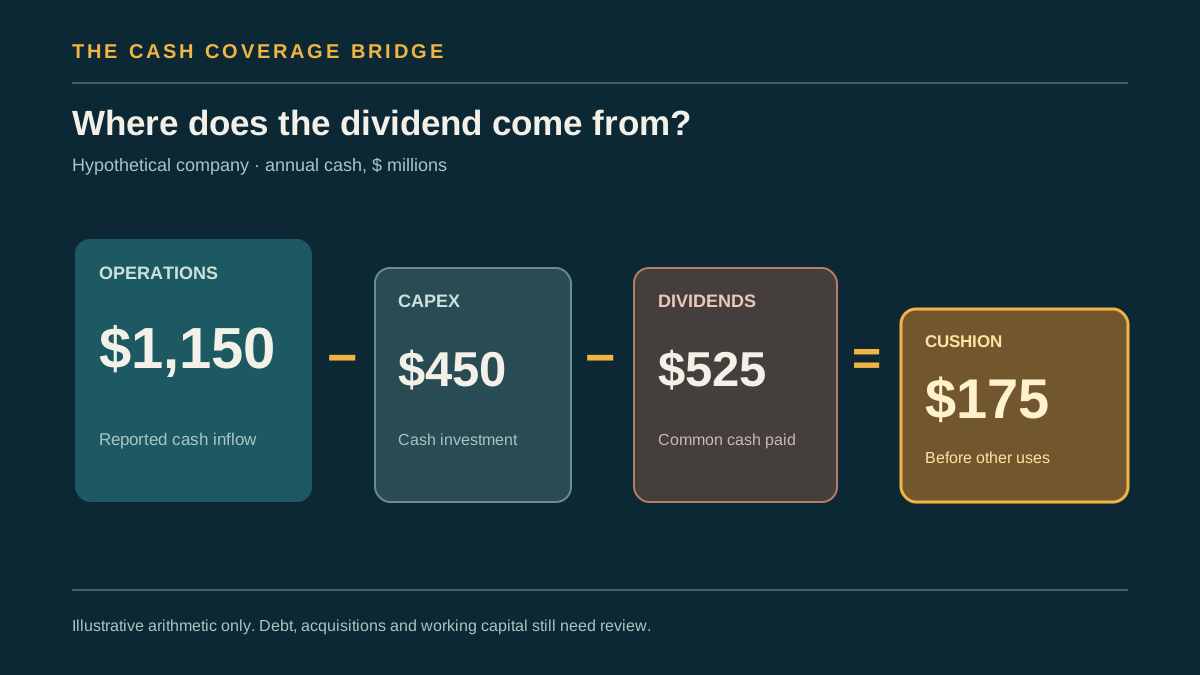
Initial screen = reported operating cash flow − clearly identified cash capital spending − common dividends paid.
This is an analytical bridge, not a GAAP subtotal or a rule that a board must follow.
2. Compare several years, not a single green quarter
Imagine the following entirely hypothetical operating company. All figures are annual and in millions of dollars; the table does not describe a real security.
| Hypothetical annual cash flow | Year 1 | Year 2 | Year 3 |
|---|---|---|---|
| Operating cash flow | $900 | $1,000 | $1,150 |
| Cash capital spending | $300 | $400 | $450 |
| Simple free cash flow | $600 | $600 | $700 |
| Common dividends paid | $450 | $480 | $525 |
| Cash after capital spending and dividends | $150 | $120 | $175 |
The dividend was covered in all three years under this definition. Yet the middle year's cushion narrowed despite higher operating cash flow, because investment and dividends also rose. That is more informative than announcing that Year 3 “covered the payout 1.33 times.” The ratio alone does not show how sensitive the cushion is to ordinary business changes.
Now suppose a later quarter reports $350 million of operating cash flow, $110 million of capital spending and $140 million of dividends. The initial screen leaves $100 million after the dividend. But the cash-flow reconciliation shows a $160 million release of working capital, perhaps from collecting receivables or reducing inventory. If that release does not recur and everything else stays equal, the analytical cash cushion becomes a $60 million shortfall: ($350m − $160m) − $110m − $140m. This adjustment is a scenario, not a restatement of the reported quarter. A working-capital improvement may be sustainable; the investor's job is to understand its cause before extrapolating it.
The reverse can also happen. A seasonal inventory build may depress one quarter's operating cash flow even when full-year cash generation is sound. Read the company's explanation in the Management's Discussion and Analysis, rather than calling every shortfall a dividend warning.
3. Inspect what “capital spending” leaves out
An annual report may show cash purchases of property and equipment, while management's free-cash-flow reconciliation uses a different label or excludes a category. Do not copy a headline measure without reading the bridge to reported cash flow. The SEC specifically calls for companies to describe how their non-GAAP free cash flow is calculated.
Some managers distinguish maintenance investment, needed to keep the present business operating, from growth investment, intended to expand it. That distinction can help explain priorities, but it involves judgment and is not a universal accounting line item. The SEC filing correspondence for one issuer illustrates how a company defines and explains these two buckets. Even growth projects can become hard to defer once contracts or competitive pressures are involved. If a dividend appears covered only after removing most capital spending, ask whether the business could really sustain itself that way for several years.
Likewise, acquisitions, pension funding and debt principal payments can compete for cash without appearing in a simple operating-cash-flow-minus-capex number. A company can temporarily fund these from cash reserves or new borrowing; that is different from demonstrating a repeatable dividend funded by operations.
4. Stress the cushion, then write down what would change your mind
Return to the hypothetical Year 3. The $175 million remainder is less than one quarter of the $700 million simple free cash flow. If operating cash flow fell by $200 million while capital spending and dividends stayed flat, the annual bridge would show a $25 million deficit. That does not predict a dividend cut. The company might reduce discretionary spending, use existing cash, refinance debt or recover in the next period. But the apparent comfort was smaller than a single reported ratio suggested.
Before reaching a conclusion, record:
- The exact period, filing and calculation used for free cash flow.
- Whether the latest cash-flow change came from earnings, working capital or a one-off event.
- The capital spending required to maintain the business, and the company's explanation of any excluded investment.
- Dividends actually paid during the same period, plus the currently declared rate.
- Other near-term demands on cash and a specific condition that would make you reassess coverage.
For a bank or another financial institution, this simple industrial-company formula may be a poor tool. Regulatory capital, credit quality and institution-specific liquidity disclosures can matter more. For a REIT, use sector-specific measures and the cash commitments behind the properties; a quick free-cash-flow comparison can obscure the way real-estate investment is recorded.
The useful question is not “Was free cash flow larger than the dividend once?” It is: What recurring cash remains after maintaining the business, and how much of that cushion survives a plausible setback?