
A higher dividend yield can look like the winner until you ask what produced the cash behind it. PepsiCo and Coca-Cola both raised their dividends in 2026. Both sell products with enormous global reach. Yet their operations, capital needs and recent cash-flow statements tell different stories. The most important twist is easy to miss: Coca-Cola's unusually weak reported 2025 free cash flow includes a $6.1 billion cash payment linked to its earlier fairlife acquisition. PepsiCo's company-defined free cash flow, meanwhile, includes $528 million of property-sale proceeds. Adjusting neither number—or adjusting only the one that supports a preferred conclusion—can turn a useful comparison into a misleading one.
This is a comparison of dividend capacity, not a declaration that either stock is a better purchase at every price. We use full-year 2025 for a common baseline and then examine the latest results available as of October 20, 2026. PepsiCo has reported its third quarter; Coca-Cola has reported only its second. Coca-Cola's third-quarter results are scheduled for October 27, so its missing quarter cannot be filled in with an estimate. PepsiCo Q3 release · Coca-Cola earnings date
First, put the 2025 cash on one page
| Full-year 2025, rounded | PepsiCo | Coca-Cola |
|---|---|---|
| Company-reported free cash flow | $8.20 billion | $5.3 billion |
| Cash dividends paid | $7.64 billion | $8.8 billion |
| Reported free cash flow ÷ dividends | 1.07× | 0.60× |
| Important accounting detail | Includes $0.53 billion of property-sale proceeds | Includes a $6.1 billion fairlife contingent cash payment |
| Alternative analytical lens | $7.67 billion of operating cash flow less capital spending, or about 1.00× dividends | $11.4 billion of free cash flow excluding fairlife payment, or about 1.30× dividends |
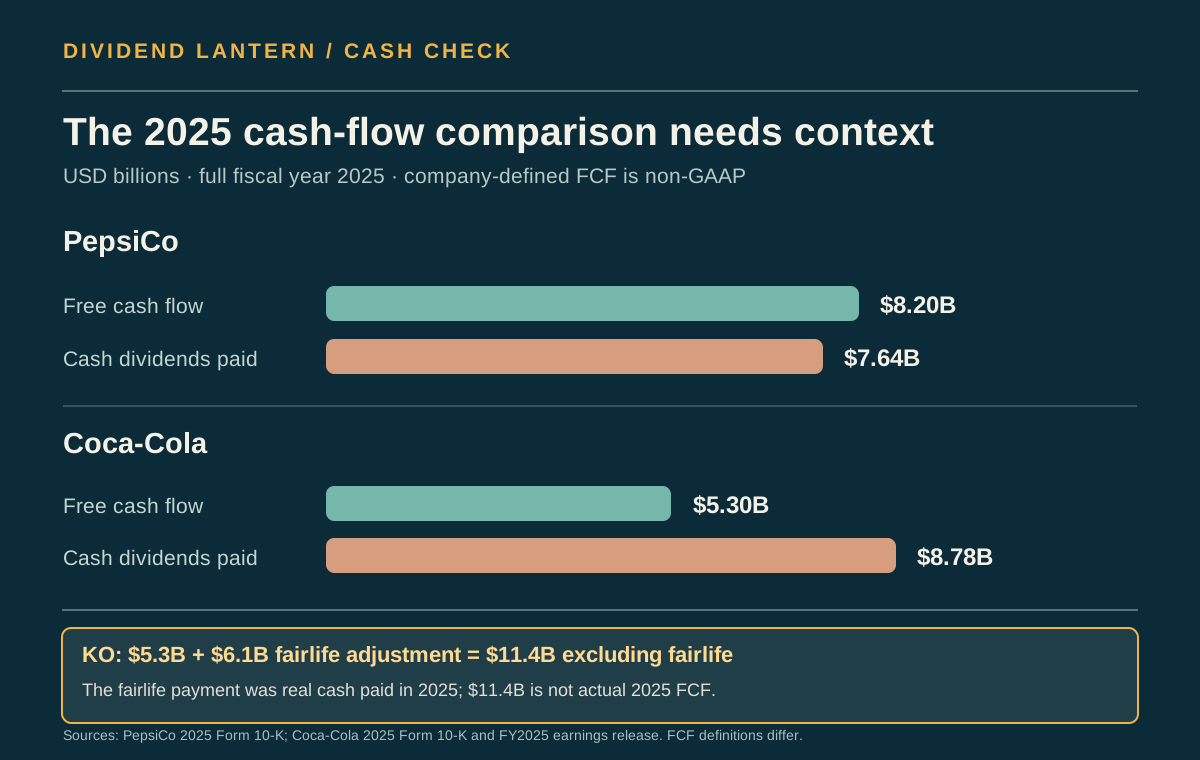
Chart: 2025 figures. The $6.1 billion fairlife payment was real cash spent; the adjusted Coca-Cola bar is an analytical non-GAAP view, not actual cash retained in 2025. Table figures are rounded.
PepsiCo defines free cash flow as operating cash flow minus capital spending plus sales of property, plant and equipment. Its 2025 filing shows $12.087 billion of operating cash flow, $4.415 billion of capital spending, $528 million of property-sale proceeds and $7.638 billion of dividends paid. The reported $8.200 billion of free cash flow exceeded dividends by $562 million. If we use the simpler operating-cash-flow-minus-capex calculation and exclude the asset-sale proceeds, the difference shrinks to roughly $34 million. That does not signal an imminent dividend cut; it shows that the cash cushion was narrow on that measure in that year. PepsiCo 2025 Form 10-K
Coca-Cola reported $5.3 billion of 2025 free cash flow and $8.8 billion of dividends paid. Taken literally, those figures show a $3.5 billion shortfall. But Coca-Cola also disclosed that the cash-flow figure included a real $6.1 billion contingent consideration payment related to the 2020 fairlife acquisition. The company reports $11.4 billion of free cash flow excluding that payment, a non-GAAP figure that would exceed dividends by approximately $2.6 billion. Excluding the payment is useful for thinking about ongoing cash generation; it does not erase the cash that left the business or the need to fund it. Coca-Cola full-year 2025 results
Neither adjustment is a perfect mirror image. A property sale can be legitimate cash, but it is not necessarily recurring operating cash. A contingent acquisition payment is a genuine cash obligation, but it is not necessarily representative of next year's beverage operations. For dividend investors, the useful question is: How much cash is left after the recurring needs of the business, before counting on asset sales or treating acquisition payments as an annual expense? The two companies also define free cash flow differently, so their company-reported figures should never be compared without reading the definitions.
The businesses underneath the familiar brands
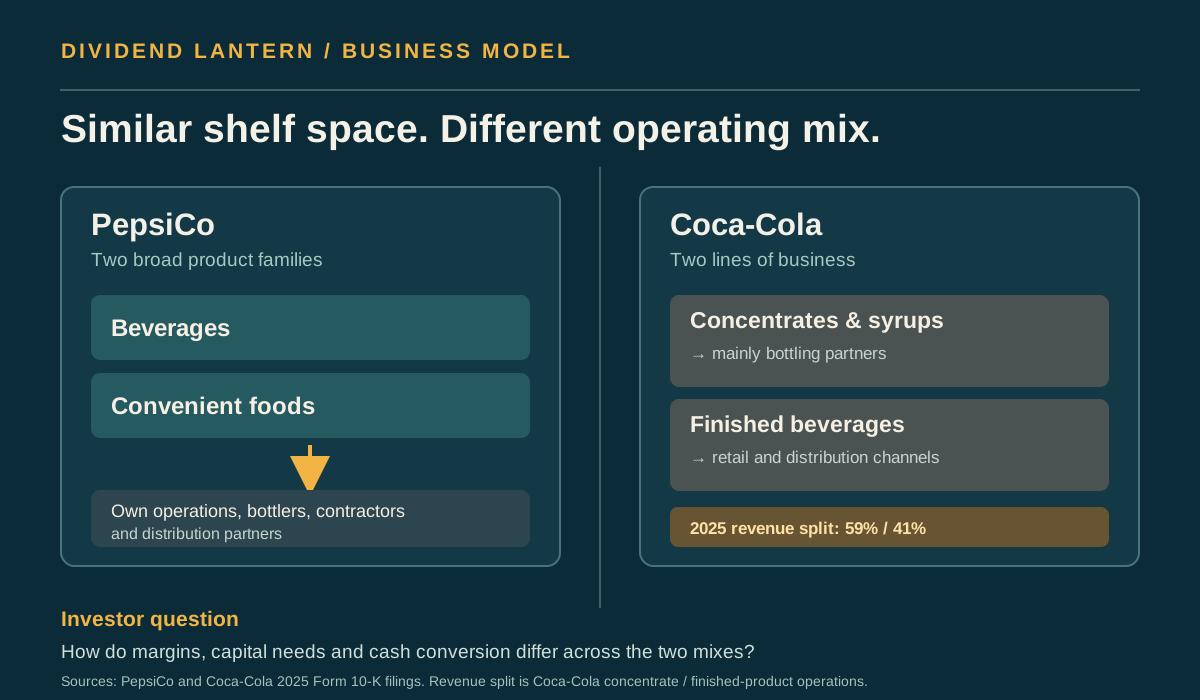
PepsiCo is a food and beverage company. Its North American convenient-food operation sells products such as Lay's, Doritos, Cheetos and Quaker through stores, distributors and direct-store-delivery networks. The beverage businesses combine company operations, independent bottlers and franchise models in different markets. That broad mix diversifies demand, but it also brings ingredients, packaging, factories, warehouses and merchandising into the dividend equation. PepsiCo identifies affordability pressure, possible shifts to lower-priced products and changing eating habits among its business risks. Those are risks to monitor, not evidence that a particular change in consumer behavior has already caused a dividend problem. PepsiCo 2025 Form 10-K
Coca-Cola focuses on beverages and relies heavily on its network of bottling partners. It sells concentrates and beverage bases, including syrups, but it also sells certain finished beverages and still has consolidated bottling and distribution operations. Describing the parent company as only a syrup seller leaves out a material part of its business. The 2025 filing says Coca-Cola continues to seek opportunities to refranchise consolidated bottling operations, an approach that can reduce the capital tied to those activities over time but depends on capable partners. Its own risks include input costs, retailer bargaining power and the performance of bottlers. Coca-Cola 2025 Form 10-K
These structures help explain why a simple comparison of revenue or operating margin is inadequate. They do not prove that one brand has a permanent advantage. Investors need to ask how growth translates into cash after reinvestment in each model.
Both dividends rose—but a raise is only the beginning
In February, PepsiCo announced a 4% increase in its annualized dividend, from $5.69 to $5.92 per share, effective with the June 2026 payment. It projected approximately $7.9 billion of total 2026 dividends and $1.0 billion of share repurchases. Its October third-quarter release kept that cash-return outlook while lowering the forecast for full-year core EPS growth to 2.5%–3.5%, from the previous low end of a 5%–7% range. These earnings measures are company-defined non-GAAP figures. A slower expected earnings path matters because future dividend increases must eventually be financed by cash generation, not the history of previous increases. PepsiCo dividend announcement · PepsiCo Q3 release
Coca-Cola approved an approximately 4% increase, from $0.51 to $0.53 per quarter, or $2.12 annualized. It described this as its 64th consecutive annual dividend increase. That record is impressive, but the forward-looking question remains whether cash generated after reinvestment can support future increases and other capital commitments. Coca-Cola dividend release
Dividend yield adds a separate consideration. Yield rises when the stock price falls even if the dividend does not change. A higher yield may improve an investor's entry price, or it may indicate that the market is pricing in slower growth or greater risk. The dividend per share, the cash needed to pay it, and the price of the stock should be examined separately. None is a substitute for the others.
What the 2026 reports say—and what they do not
PepsiCo's third-quarter revenue rose 5.6% to $25.274 billion, while organic revenue grew 3.1%. Core operating profit rose 3%. The company described sequential improvement in North American convenient foods, including savory-snack volume growth, alongside lower effective net pricing. Its North American beverages business reported 5% net revenue growth, primarily benefiting from acquisitions made in 2025. These are more nuanced signals than a claim that all U.S. demand is either collapsing or fully recovered. PepsiCo Q3 release
The cash-flow question remains tight. Through the first 36 weeks of PepsiCo's 2026 fiscal year, company-defined free cash flow was $5.857 billion and cash dividends paid were $5.935 billion. That is a roughly $78 million gap at an interim date. Interim cash flow and dividend timing can vary significantly, so this is a monitoring point rather than a full-year verdict. In its report, PepsiCo also points to working-capital comparisons as one reason operating cash flow improved over the prior year. The next full-year statement will tell us whether that improvement becomes a larger durable buffer. PepsiCo Q3 Form 10-Q
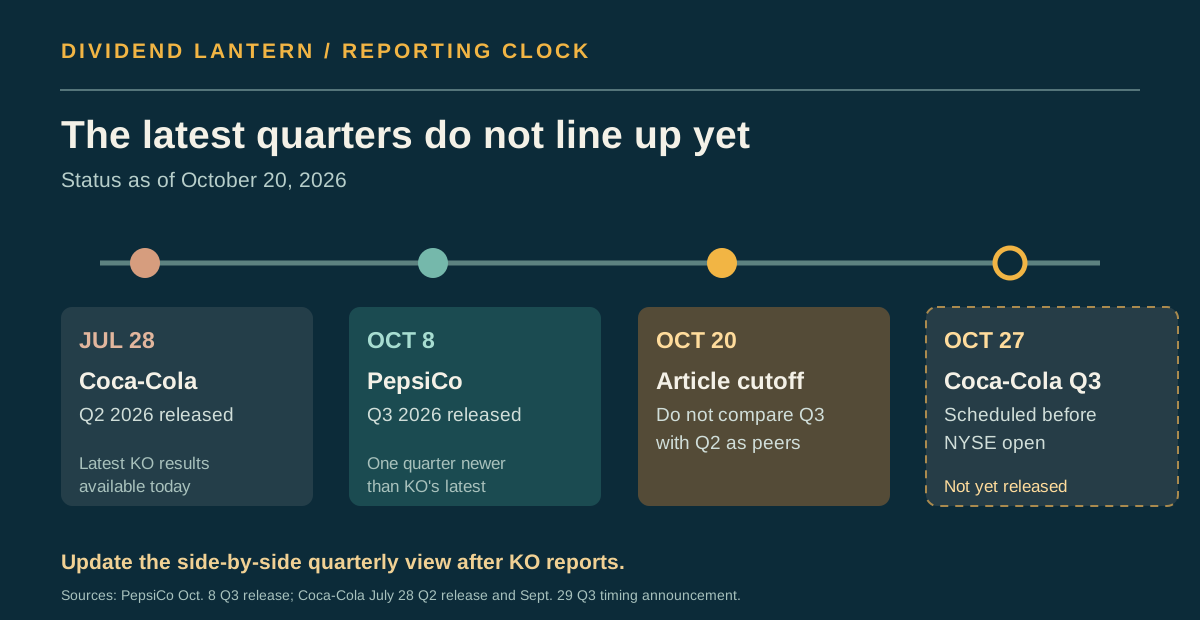
Coca-Cola's latest reported quarter is Q2 2026, ending July 3. Net revenue grew 7% and organic revenue 6%; the company reported $6.9 billion of free cash flow for the first half of the year. It raised its full-year 2026 free-cash-flow outlook to approximately $12.4 billion, which is a forecast rather than cash already earned. We cannot compare Coca-Cola's six months with PepsiCo's 36 weeks as if they were synchronized periods. We can say that both sets of data provide questions for the next release. Coca-Cola Q2 results
Coca-Cola plans to report Q3 on October 27, before the New York Stock Exchange opens. Until then, a table declaring a winner on Q3 sales, cash flow or dividend coverage would combine results from different reporting dates. Coca-Cola earnings schedule
Debt and valuation: the two tests outside the payout ratio
Free cash flow is not a savings account reserved for dividends. Both companies borrow, repay debt, invest in brands and facilities, and may pursue acquisitions or repurchases. PepsiCo's 2025 10-K shows $6.861 billion of short-term debt obligations and $42.321 billion of long-term debt obligations at year-end. Coca-Cola's 2025 filing also describes substantial borrowings and future maturities. These balances cannot be ranked fairly without also considering cash, interest expense, maturity schedules, operating scale and the stability of future cash generation. A dividend covered in one period may leave less flexibility if interest costs or investment requirements rise. PepsiCo 2025 Form 10-K · Coca-Cola 2025 Form 10-K
Then there is price. Even if Coca-Cola's recurring cash coverage looks stronger on this particular 2025 adjustment, that does not make its shares automatically attractive at every valuation. Likewise, PepsiCo's thinner 2025 conventional free-cash-flow buffer does not by itself make a lower share price a bargain or a trap. At the price available on the day of an investment, compare each stock's dividend yield and free-cash-flow yield with its expected growth, balance-sheet obligations and a comparable Treasury yield. Ask what assumptions would have to go right for the dividend to keep growing. This article intentionally avoids a live yield because that number changes with the share price and would age quickly.
A practical watchlist for the next report
- For Coca-Cola on October 27: compare new operating cash flow, capital spending and dividends on a year-to-date basis, then check whether the $12.4 billion full-year free-cash-flow forecast changes. Watch volume versus price/mix so that revenue growth is not mistaken for higher unit demand.
- For PepsiCo at its next update: check whether North American food volumes improve without prolonged pressure on pricing and margin, and whether full-year cash flow covers the projected $7.9 billion dividend without relying on unusual asset sales.
- For both: examine debt maturities, interest expense and acquisition spending before assuming all free cash flow can be distributed. Compare shares at the actual market prices then available, rather than declaring a permanent winner based on one year of cash flow.
Our conclusion: Coca-Cola's 2025 reported free-cash-flow shortfall has a specific, disclosed fairlife explanation, while PepsiCo's 2025 cash cushion looks much narrower when property-sale proceeds are removed. The adjustment makes the comparison more informative, but neither single-year ratio settles long-term dividend safety. The answer depends on the next cash-flow statements, balance-sheet demands and the price paid for either stock.
This is educational analysis of public company filings, not personalized investment advice. Company-defined and adjusted free-cash-flow figures are non-GAAP; definitions differ. Dividend declarations remain subject to each company's board.